 Back
BackHeating Curves and Phase Diagrams: Step-by-Step Guidance
Study Guide - Smart Notes
 Tailored notes based on your materials, expanded with key definitions, examples, and context.
Q1. How much heat (in kJ) is required to convert 52.0 g of ice (molar mass = 18.02 g/mole) at –10.0°C to steam at 100°C?
Background
Topic: Heating Curves and Phase Changes
This question tests your understanding of energy changes during phase transitions and temperature changes, including the use of specific heat and enthalpy values.
Key Terms and Formulas
Specific heat (): Amount of heat required to raise the temperature of 1 g of a substance by 1°C.
Heat of fusion (): Energy required to melt 1 mole of a solid.
Heat of vaporization (): Energy required to vaporize 1 mole of a liquid.
Key formulas:
(for temperature change)
(for melting)
(for boiling)
Step-by-Step Guidance
Calculate the heat required to warm the ice from –10.0°C to 0°C using .
Calculate the heat required to melt the ice at 0°C using .
Calculate the heat required to warm the water from 0°C to 100°C using .
Calculate the heat required to vaporize the water at 100°C using .
Set up the calculation for the heat required to warm the steam from 100°C to 100°C (if needed, but in this case, steam ends at 100°C).
Try solving on your own before revealing the answer!
Q2. Determine the final state (phase of matter) and temperature (in °C) of 100. g of water originally at 25.0°C after 50.0 kJ of heat have been added to it.
Background
Topic: Heating Curves and Energy Calculations
This question tests your ability to track energy input and determine phase changes and final temperature using specific heat and enthalpy values.
Key Terms and Formulas
Specific heat (): Amount of heat required to raise the temperature of 1 g of a substance by 1°C.
Heat of vaporization (): Energy required to vaporize 1 mole of a liquid.
Key formulas:
(for temperature change)
(for boiling)
Step-by-Step Guidance
Calculate the heat required to raise the temperature of water from 25.0°C to 100°C using .
Compare to the total heat added (50.0 kJ) to see if all the water reaches 100°C or if some heat remains for phase change.
If there is leftover heat, calculate how much water can be vaporized using .
Set up the calculation to determine the final temperature or phase based on the remaining heat.
Try solving on your own before revealing the answer!
Q3. How much heat (in kJ) is given off when 1.00 g of steam at 110.5°C freezes to ice at -22.3°C?
Background
Topic: Cooling Curves and Phase Changes
This question tests your understanding of energy released during cooling and phase transitions, including condensation and freezing.
Key Terms and Formulas
Specific heat (): Amount of heat required to change temperature.
Heat of condensation (): Energy released when 1 mole of vapor condenses.
Heat of freezing (): Energy released when 1 mole of liquid freezes.
Key formulas:
(cooling steam)
(condensation)
(cooling water)
(freezing)
(cooling ice)
Step-by-Step Guidance
Calculate the heat released as steam cools from 110.5°C to 100°C using .
Calculate the heat released as steam condenses at 100°C using .
Calculate the heat released as water cools from 100°C to 0°C using .
Calculate the heat released as water freezes at 0°C using .
Set up the calculation for the heat released as ice cools from 0°C to -22.3°C using .
Try solving on your own before revealing the answer!
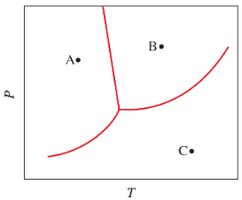
Q4. A basic phase change diagram of water is shown below. Label each of the regions in the diagram, then answer the questions below.
Background
Topic: Phase Diagrams
This question tests your ability to interpret phase diagrams and predict phase changes based on changes in temperature and pressure.
Key Terms and Concepts
Phase diagram: Graphical representation of the states of matter as a function of temperature and pressure.
Triple point: The unique set of conditions where all three phases coexist.
Critical point: The end point of the liquid-gas boundary, beyond which the liquid and gas phases are indistinguishable.
Step-by-Step Guidance
Identify and label the regions corresponding to solid, liquid, and gas on the diagram.
For part (a), consider what happens to the phase at point A when temperature is increased at constant pressure.
For part (b), consider what happens to the phase at point B when pressure is decreased at constant temperature.
For part (c), consider what happens to the phase at point C when temperature is decreased at constant pressure.
Locate and mark the triple point and critical point on the diagram as instructed.
Try solving on your own before revealing the answer!
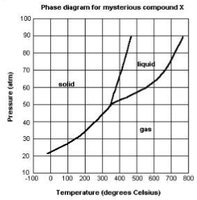
Q5. A phase diagram for mysterious compound “X” is shown below. Answer the questions below based on this curve.
Background
Topic: Phase Diagrams and Critical Points
This question tests your ability to interpret a phase diagram and predict phase behavior under different conditions.
Key Terms and Concepts
Critical temperature: The highest temperature at which a substance can exist as a liquid.
Triple point: The unique set of conditions where all three phases coexist.
Step-by-Step Guidance
Identify the critical temperature by locating the end of the liquid-gas boundary on the diagram.
Determine the phase of compound X at room temperature (25°C) and 15 atm by finding the corresponding region on the diagram.
Locate the triple point on the diagram and note its temperature and pressure.
For the scenario at 45 atm and 100°C, predict what happens when temperature is raised to 400°C at constant pressure by following the phase boundaries.
Explain why compound X cannot be boiled at 200°C and discuss whether it could be physically consumed based on the diagram.
Try solving on your own before revealing the answer!
