 Back
BackLine Spectrum and Electronic Transitions in the Hydrogen Atom
Study Guide - Smart Notes
 Tailored notes based on your materials, expanded with key definitions, examples, and context.
Line Spectrum of the Hydrogen Atom
Introduction to Spectroscopy and Atomic Structure
Spectroscopy is a fundamental technique in chemistry used to analyze the light emitted or absorbed by substances, providing insight into atomic structure. Light exhibits a dual nature, possessing both particle-like and wave-like properties. The particle aspect is represented by photons, which are packets of energy, while the wave aspect is characterized by frequency (\nu) and wavelength (\lambda). The energy of a photon is directly proportional to its frequency, as described by the equation:
Energy of a photon:
Planck's constant (h): Js
Speed of light (c): m/s
Light in the visible and ultraviolet regions can cause changes in the energy of electrons within atoms, molecules, or ions, leading to phenomena such as neon signs and street lamps.
Electronic States and Transitions
The ground state of an atom is its lowest possible energy state, with electrons occupying the lowest energy levels. When an atom absorbs energy, an electron transitions to a higher energy level, entering an excited state. The energy absorbed is equal to the difference between the ground and excited states, reflecting the quantized nature of atomic energy levels.
Ground state: Lowest energy configuration of electrons
Excited state: Higher energy configuration after absorption of energy
Quantization: Energy changes occur in discrete amounts
Atoms in excited states are unstable and return to lower energy states by emitting energy. The emitted energy is quantized and corresponds to the difference between energy levels. The emission spectrum of an atom consists of discrete lines, each representing a specific electronic transition.
Emission Spectrum and Energy Calculations
The emission spectrum is a plot of emitted radiation as a function of wavelength. Each atom has a characteristic emission spectrum due to quantized energy levels. The energy difference between levels determines the wavelength of the emitted light, as described by the following formula:
Energy difference and wavelength relationship:
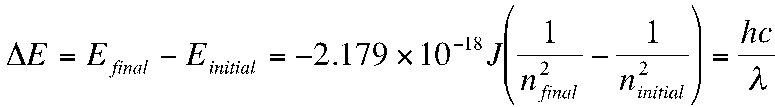
Where:
and are the principal quantum numbers of the initial and final energy levels
is the wavelength of the emitted photon
is Planck's constant
is the speed of light
Experimental Design: Observing Hydrogen Line Spectrum
In this experiment, the emission spectrum of the hydrogen atom is observed using a spectroscope. The wavelengths of the spectral lines are recorded and used to determine the electronic transitions. For hydrogen, visible spectral lines correspond to transitions ending at (the Balmer series).
Procedure:
Observe the line spectrum of hydrogen through a spectroscope.
Record the exact wavelengths of each observed line.
Optionally, observe line spectra of helium and xenon.
Bohr's Equation for Energy Levels
The allowed energy levels of the hydrogen atom are calculated using Bohr's equation:
For example:
: J
: J
Students are tasked with calculating the energies for to and expressing all answers in the same power of ten.
Calculating Photon Energy and Wavelength
The energy of a photon emitted during a transition is:
The wavelength is then calculated using:
Students complete tables for various transitions, such as , , , etc., calculating both photon energy and wavelength.
Comparing Experimental and Calculated Wavelengths
Experimental wavelengths are compared to calculated values to determine the corresponding electronic transitions. This helps identify which transitions produce the observed spectral lines.
Energy Level Diagram for Hydrogen Atom
Students construct a scaled energy level diagram for hydrogen, labeling and energy levels, indicating the ground state, and marking observed transitions with arrows. Each transition is labeled with its wavelength and color.
Ground state:
Excited states: to
Observed transitions: Downward arrows from higher to lower energy levels, labeled with wavelength and color
Key Terms and Concepts
Photon: A quantum of electromagnetic energy
Emission spectrum: Discrete lines corresponding to electronic transitions
Bohr model: Describes quantized energy levels in hydrogen
Balmer series: Visible transitions ending at
Example Calculation
For the transition :
J (example value)
J
J$
This calculation yields the wavelength of the emitted photon for the transition.
Additional info: The experiment reinforces concepts from Chapter 8 (Quantum-Mechanical Model of the Atom) and Chapter 9 (Periodic Properties of the Elements), focusing on quantized energy levels, electronic transitions, and the interpretation of atomic spectra.
