 Back
BackMeasurements, Accuracy, Precision, and Density Determination in the Chemistry Laboratory
Study Guide - Smart Notes
 Tailored notes based on your materials, expanded with key definitions, examples, and context.
Experiment A1: Measurements
Introduction to Laboratory Measurements
Accurate and precise measurements are fundamental to all laboratory work in general chemistry. Understanding the limitations of measurement tools and the significance of each digit in a measured value is essential for reliable data collection and analysis.
Measurement Tools: Common laboratory instruments include graduated cylinders, volumetric flasks, burettes, electronic balances, and thermometers.
Uncertainty: Every measurement has an inherent uncertainty due to instrument limitations.
Multiple Measurements: Repeating measurements improves reliability and allows for statistical analysis.
Accuracy and Precision
Understanding the difference between accuracy and precision is crucial for interpreting experimental results.
Accuracy: The closeness of a measured value to the true or accepted value.
Precision: The closeness of repeated measurements to each other.
Percent Error: Used to quantify accuracy, calculated as:
A positive percent error indicates the experimental value is higher than the true value; a negative percent error indicates it is lower.
Smaller percent error signifies greater accuracy.
Examples of Accuracy and Precision
Not Precise and Not Accurate: Measurements are scattered and far from the true value.
Precise but Not Accurate: Measurements are close to each other but far from the true value.
Accurate but Not Precise: Measurements are close to the true value but scattered.
Precise and Accurate: Measurements are both close to each other and to the true value.
Types of Errors in Measurement
Systematic Error: Caused by faulty equipment or improper use; can often be minimized or eliminated by calibration and proper technique.
Random Error: Caused by unpredictable variations in experimental conditions; cannot be completely eliminated.
Uncertainty and Significant Figures
Instrument Precision and Uncertainty
Each measuring device has a specific precision, which determines the uncertainty of measurements taken with that instrument.
Graduated Instruments: Devices like rulers, thermometers, burettes, and graduated cylinders allow estimation between graduation marks, increasing the number of significant digits.
Fixed-Volume Instruments: Volumetric flasks and pipettes deliver a single, precise volume.
Significant Figures: The number of meaningful digits in a measurement, determined by the instrument's precision. The last digit is always an estimate.
For example, a 50-mL graduated cylinder can be read to the nearest 0.1 mL, while a burette can be read to 0.01 mL, providing greater precision and smaller uncertainty.
Digital Instruments
Digital Thermometer: All displayed digits are recorded; uncertainty is in the last digit.
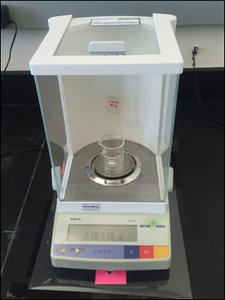
Electronic Balance: All displayed digits are recorded; uncertainty is in the last digit.
Statistical Tools for Data Analysis
Mean and Standard Deviation
Statistical analysis helps summarize and interpret experimental data.
Mean (Average): The sum of all data points divided by the number of points.
Standard Deviation (S.D.): Measures the spread of data points around the mean.
Spreadsheet programs (e.g., Microsoft Excel) can calculate these values using built-in functions: =AVERAGE() and =STDEV().
Graphical Representation of Data
Plotting and Interpreting Graphs
Graphical analysis is used to identify relationships between variables, such as mass and volume, which are directly proportional for a pure substance.
Direct Proportionality: If mass and volume are directly proportional, their relationship can be expressed as , where is the slope.
Density: The slope of a mass (y-axis) vs. volume (x-axis) plot gives the density of the substance.
Spreadsheet programs can be used to plot data, add trendlines, and display the regression equation and correlation coefficient.
Experimental Design: Measuring Density of Water
Definition and Calculation of Density
Density is a fundamental physical property defined as the mass per unit volume of a substance.
Formula:
For water at room temperature, the accepted density is 1.00 g/mL.
Laboratory Procedures for Density Measurement
Density of water is measured using different laboratory tools to compare their precision and accuracy.
10-mL Graduated Cylinder: Measure mass and volume for three trials, calculate density, average, standard deviation, and percent error.
100-mL Graduated Cylinder: Repeat as above with a larger cylinder.
25-mL Volumetric Flask: Repeat as above with a volumetric flask.
Burette: Dispense measured volumes into a beaker, record mass changes, plot mass vs. volume, and determine density from the slope.
Instructions for Data Analysis and Graphing
Steps for Plotting and Regression Analysis
Enter x-data (volume) and y-data (mass) in two columns.
Select the data and insert an XY-scatter plot.
Add a trendline, display the equation and R-squared value, and set the intercept to zero if appropriate.
The slope of the regression line gives the density; compare to the accepted value to calculate percent error.
Data Tables for Density Measurement
Purpose of Data Tables
Data tables are used to organize measurements and calculations for each experimental part. They facilitate the calculation of density, average, standard deviation, and percent error for each method.
Trial | Mass of Empty Vessel (g) | Volume of Water (mL) | Mass of Vessel + Water (g) | Mass of Water (g) | Density (g/mL) |
|---|---|---|---|---|---|
1 | |||||
2 | |||||
3 |
Additional info: Similar tables are provided for each instrument (10-mL and 100-mL graduated cylinders, volumetric flask, burette) to ensure systematic data collection and analysis.
Summary
Accurate and precise measurements are essential for reliable experimental results in chemistry.
Understanding uncertainty, significant figures, and error types improves data interpretation.
Statistical and graphical tools help analyze and present data effectively.
Comparing different measurement tools highlights their relative precision and accuracy in determining physical properties such as density.
