 Back
Orbital Radial Distribution and Quantum Numbers – General Chemistry Study Guidance
Study Guide - Smart Notes
 Tailored notes based on your materials, expanded with key definitions, examples, and context.
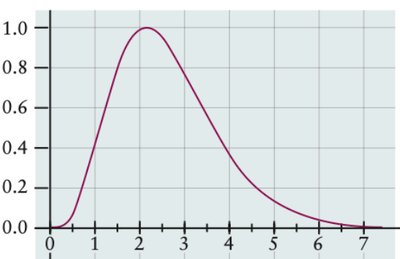
Q21. Which orbital is this radial distribution function consistent with? Select all that apply.
Background
Topic: Atomic Orbitals and Radial Distribution Functions
This question tests your understanding of how the shape of a radial distribution function relates to different atomic orbitals (such as s, p, and d orbitals) and their quantum numbers.
Key Terms and Formulas:
Radial Distribution Function: Describes the probability of finding an electron at a certain distance from the nucleus.
Quantum Numbers: n (principal), l (angular momentum), ml (magnetic).
Orbital Types: s (l=0), p (l=1), d (l=2).
Nodes: Points where the probability is zero. s orbitals have only radial nodes, p and d orbitals have both radial and angular nodes.
Step-by-Step Guidance
Examine the provided radial distribution function graph. Notice the curve starts at zero, rises to a maximum, and then falls off, with no nodes (zero crossings) between the origin and the maximum.
Recall that s orbitals (such as 1s) have a single peak and no angular nodes, while higher s orbitals (like 2s, 3s) have radial nodes. p and d orbitals have angular nodes and may have radial nodes depending on n.
Compare the graph to typical shapes for 1s, 2p, and 3d orbitals. The absence of nodes suggests a 1s orbital, but higher orbitals can also have similar shapes with more complexity.
Review the answer choices and match the graph to the orbital(s) whose radial distribution function fits the observed pattern.
Consider the quantum numbers for each orbital: 1s (n=1, l=0), 2p (n=2, l=1), 3d (n=3, l=2), etc.
Try solving on your own before revealing the answer!
Final Answer:
The radial distribution function shown is most consistent with a 1s orbital, which has no nodes and a single peak. Among the answer choices, the correct orbital is 1s.
This is because the 1s orbital's radial distribution function starts at zero, rises to a maximum, and then decreases, matching the graph provided.
