 Back
BackPhase Equilibria and the Gibbs Phase Rule in One-Component Systems
Study Guide - Smart Notes
 Tailored notes based on your materials, expanded with key definitions, examples, and context.
The Gibbs Phase Rule and Phase Equilibria
Introduction to the Phase Rule
The Gibbs Phase Rule is a fundamental principle in chemical thermodynamics that describes the number of degrees of freedom (variance) in a system at equilibrium. It is especially useful for understanding phase diagrams and the behavior of pure substances under varying conditions of temperature and pressure.
Formula: The phase rule is given by: where: F = degrees of freedom (number of independent intensive variables), C = number of components, P = number of phases in equilibrium.
Variance (F): The number of intensive variables (such as temperature and pressure) that can be changed independently without altering the number of phases in equilibrium.
Component (C): The minimum number of independent species required to define the composition of all phases present in the system.
Phase (P): A physically distinct and mechanically separable portion of a system (e.g., solid, liquid, gas).
Example: For a one-component system (C = 1), the phase rule simplifies to .
Application of the Phase Rule to One-Component Systems
For a pure substance (C = 1), the phase rule helps determine the number of variables needed to specify the state of the system:
Single-phase region (P = 1): — Both temperature and pressure can be varied independently.
Two-phase equilibrium (P = 2): — Only one variable (either temperature or pressure) can be changed independently; the other is fixed by the phase boundary.
Triple point (P = 3): — No degrees of freedom; temperature and pressure are fixed for all three phases to coexist.
Four phases (P = 4): Not possible for a one-component system, as this would yield a negative degree of freedom.
Phase Diagrams
A phase diagram is a graphical representation of the equilibrium between different phases of a substance as a function of temperature and pressure. Each region, line, and point on the diagram corresponds to a specific phase or equilibrium between phases.
Regions: Represent single phases (solid, liquid, vapor).
Lines (boundaries): Represent equilibrium between two phases (e.g., solid-liquid, liquid-vapor).
Triple point: The unique set of conditions where all three phases coexist in equilibrium.
Critical point: The end point of the liquid-vapor boundary, beyond which the liquid and vapor phases are indistinguishable.

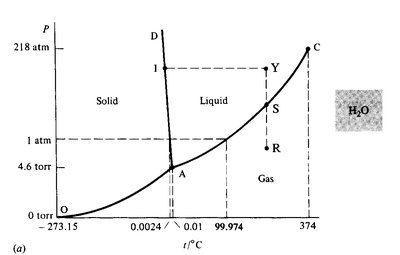
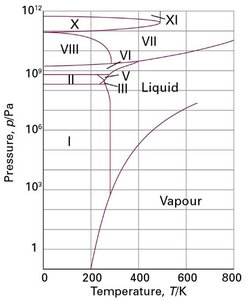
Detailed Example: Phase Diagram of Water (H2O)
The phase diagram of water is a classic example used to illustrate the application of the phase rule and the unique properties of water under different conditions.
Solid-Liquid Boundary: The melting point of ice decreases with increasing pressure, which is unusual compared to most substances.
Triple Point: The temperature and pressure at which ice, liquid water, and water vapor coexist (, torr).
Critical Point: The highest temperature and pressure at which liquid and vapor can coexist (, atm).
High-Pressure Phases: Water has multiple solid phases (ice II, III, IV, etc.) at high pressures.
Phase Diagram of Carbon Dioxide (CO2)
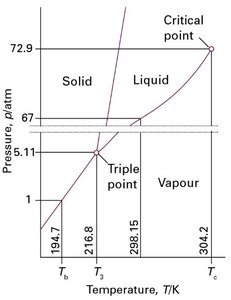
Carbon dioxide exhibits different phase behavior compared to water, with important implications for its practical uses.
Triple Point: , atm. At 1 atm, solid CO2 sublimes directly to gas ("dry ice").
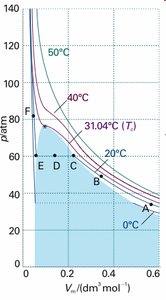
Critical Point: , atm. Above this, CO2 exists as a supercritical fluid.
Supercritical Fluids: Above the critical temperature, CO2 cannot be liquefied by pressure alone. Supercritical CO2 is used in extraction and other technologies.
Supercritical Fluids and Planetary Atmospheres
Supercritical fluids have properties of both liquids and gases and are important in both industrial applications and planetary science.
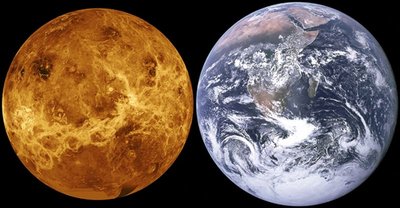
Venus: The surface atmosphere of Venus is a supercritical fluid, primarily composed of CO2 at high temperature and pressure, above the critical point of CO2.
Phase Diagram of Carbon (C)
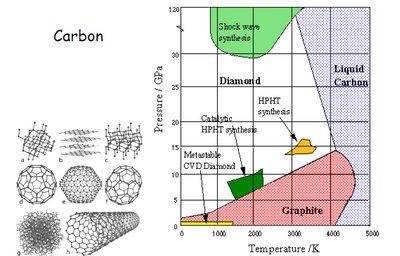
Carbon exists in several allotropes, including graphite and diamond, and its phase diagram is important for understanding synthetic diamond production.
Graphite and Diamond: At standard conditions, graphite is the stable form of carbon. Diamond is stable only at high pressures and temperatures.
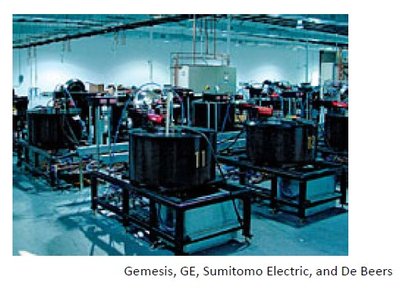
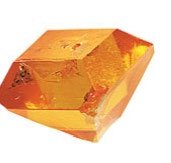
Industrial Synthesis: Synthetic diamonds are produced by subjecting graphite to high pressures and temperatures, as indicated on the phase diagram.
Summary Table: Application of the Gibbs Phase Rule (One-Component System)
Number of Phases (P) | Degrees of Freedom (F) | Example |
|---|---|---|
1 | 2 | Single-phase region (solid, liquid, or vapor) |
2 | 1 | Phase boundary (e.g., solid-liquid equilibrium) |
3 | 0 | Triple point (all three phases coexist) |
4 | -1 (forbidden) | Not possible for one-component system |
Key Takeaways
The Gibbs Phase Rule provides a systematic way to determine the number of variables that can be independently controlled in a system at equilibrium.
Phase diagrams visually represent the equilibrium between phases and are essential for understanding the behavior of substances under different conditions.
Water, carbon dioxide, and carbon each have unique phase diagrams with important scientific and industrial implications.
