 Back
BackPhase Transitions, Vapor Pressure, and Phase Diagrams: Study Notes
Study Guide - Smart Notes
 Tailored notes based on your materials, expanded with key definitions, examples, and context.
Phase Transitions and Properties of Matter
Classification of Phases
Substances exist in three primary phases: solid, liquid, and gas. Each phase is characterized by distinct properties related to compressibility, density, molecular motion, and intermolecular forces (IMFs).
Gas: Compressible, low density, molecules move freely, IMFs are weakest.
Liquid: Not compressible, high density, molecules move but are closer together, IMFs are intermediate.
Solid: Not compressible, high density, molecules are fixed in place, IMFs are strongest.
Phase transitions occur when a substance changes from one phase to another, such as melting, freezing, vaporization, condensation, sublimation, and deposition.
Phase Change Temperatures
Melting Point (Tm): Temperature at which a solid becomes a liquid. Higher IMFs result in higher melting points.
Boiling Point (Tb): Temperature at which a liquid becomes a gas. Higher IMFs result in higher boiling points.
Sublimation Point: Temperature at which a solid becomes a gas directly. Occurs at low pressures.
Vapor Pressure and Intermolecular Forces
Vapor Pressure Concepts
Vapor pressure is the pressure exerted by a vapor in equilibrium with its liquid or solid phase. It increases with temperature as more molecules have sufficient kinetic energy to escape the liquid phase.
Stronger IMFs result in lower vapor pressure because fewer molecules can escape.
The normal boiling point is the temperature at which vapor pressure equals 1 atm.
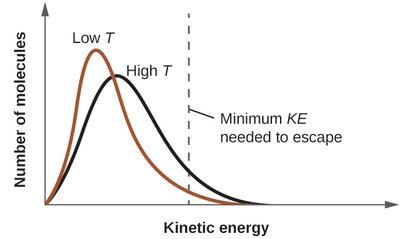
This image shows the distribution of molecular kinetic energies at low and high temperatures. At higher temperatures, more molecules have enough energy to escape the liquid phase, increasing vapor pressure.
Vapor Pressure vs. Temperature for Different Substances
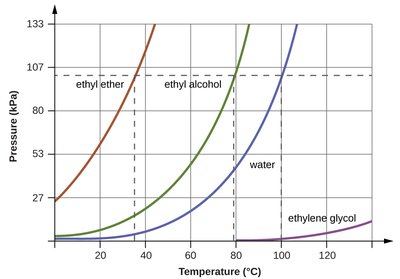
This graph compares vapor pressure as a function of temperature for ethyl ether, ethyl alcohol, water, and ethylene glycol. Substances with weaker IMFs (like ethyl ether) have higher vapor pressures and lower boiling points.
Clausius-Clapeyron Equation and Calculations
Clausius-Clapeyron Equation
The Clausius-Clapeyron equation relates vapor pressure and temperature:
: Enthalpy of vaporization
: Gas constant (8.3145 J mol-1 K-1)
, : Vapor pressures at temperatures ,
This equation can be used to calculate vapor pressure at a given temperature or determine from experimental data.
Heating Curves and Phase Change Calculations
Heating Curve Steps
When heat is added to a substance, it can either increase the temperature (no phase change) or cause a phase change (no temperature change). The total heat required is calculated in steps:
Temperature change:
Phase change:
For example, heating water from -30°C to 200°C involves heating ice, melting, heating liquid, vaporizing, and heating steam, each calculated separately.
Phase Diagrams
Phase Diagram Features
Phase diagrams are graphical representations of the phases of a substance as a function of temperature and pressure. Key features include:
Regions for solid, liquid, and gas phases
Curved lines separating phases (phase boundaries)
Triple point: All three phases coexist
Critical point: Beyond this, the substance is a supercritical fluid
On phase boundaries, two phases are in equilibrium
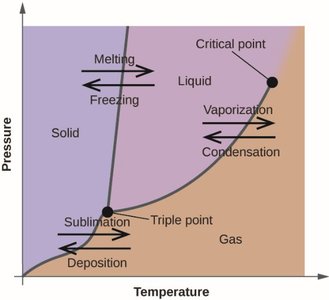
This image illustrates a typical phase diagram, showing the locations of melting, freezing, vaporization, condensation, sublimation, and deposition, as well as the triple and critical points.
Special Features of Water's Phase Diagram
The solid/liquid boundary for water slopes up and to the left, indicating that ice is less dense than liquid water (ice floats).
At the triple point, all three phases are in equilibrium.
Supercritical Fluids
A supercritical fluid is a state of matter above the critical temperature and pressure, where the substance exhibits properties of both liquids and gases. Supercritical fluids are used in extraction and purification processes.
Phase Diagram Problems and Calculations
Acetone Phase Diagram and Properties
Acetone's phase diagram includes the triple point, critical point, normal boiling and melting points, and enthalpies of vaporization and fusion. The following table summarizes acetone's properties:
Property | Value |
|---|---|
Molar Mass | 58.08 g/mol |
Triple Point | 178 K, 1.7 millitorr |
Critical Point | 235°C, 47.4 atm |
Normal Boiling Point | 329.3 K |
Normal Melting Point | 178.5 K |
ΔHvap | 30.3 kJ/mol |
ΔHfus | 5.7 kJ/mol |
Cs liquid | 124.5 J/mol·K |
Cs gas | 75.0 J/mol·K |
To heat 1.0 mole of acetone from 300.0 K to 350.0 K at 1 atm, calculate:
Heat to raise liquid from 300.0 K to 329.3 K:
Heat for vaporization at 329.3 K:
Heat to raise gas from 329.3 K to 350.0 K:
Total heat:
Vapor Pressure Calculation Example
To find the vapor pressure of acetone at 25°C, use the Clausius-Clapeyron equation with known values for , , and temperatures.
Summary Table: Phase Properties
Phase | Compressibility | Density | Molecular Motion | IMFs |
|---|---|---|---|---|
Gas | Compressible | Low | Free | Weakest |
Liquid | Not compressible | High | Relative | Intermediate |
Solid | Not compressible | High | Fixed | Strongest |
