 Back
BackSolids, Liquids, and Intermolecular Forces: Vapor Pressure, Boiling Point, and Phase Changes
Study Guide - Smart Notes
 Tailored notes based on your materials, expanded with key definitions, examples, and context.
Solids, Liquids, and Intermolecular Forces
Vapor Pressure and Boiling Point
The physical properties of liquids and solids are strongly influenced by the strength and type of intermolecular forces (IMFs) present. Vapor pressure and boiling point are two key properties that depend on IMFs.
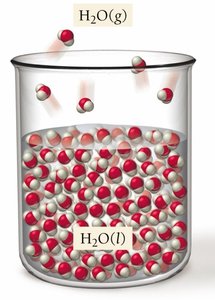
Vapor Pressure: The pressure exerted by a vapor in equilibrium with its liquid at a given temperature. Molecules with sufficient kinetic energy can escape the liquid phase and enter the gas phase, creating vapor pressure.
Boiling Point: The temperature at which the vapor pressure of a liquid equals the external pressure. The normal boiling point is defined at 1 atmosphere (760 torr).
Volatile liquids vaporize easily at ordinary temperatures, while nonvolatile liquids do not.
The rate of vaporization increases with higher temperature, greater surface area, and weaker IMFs.
Factors Affecting Vaporization
Temperature (T): Higher temperatures increase the average kinetic energy, allowing more molecules to escape.
Surface Area (A): More molecules at the surface can evaporate.
IMF Strength: Weaker IMFs allow easier escape of molecules.

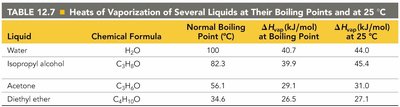
Heat of Vaporization (ΔHvap)
The heat of vaporization (ΔHvap) is the energy required to vaporize one mole of a substance at its boiling point. This process is always endothermic (ΔHvap > 0). The reverse process, condensation, is exothermic.
ΔHvap depends on temperature.
ΔHvap is typically expressed in kJ/mol.
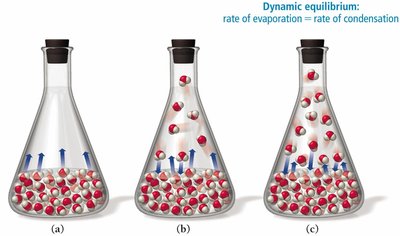
Vapor Pressure: Dynamic Equilibrium
In a closed system, vaporization and condensation occur simultaneously. When the rates are equal, the system is in dynamic equilibrium.
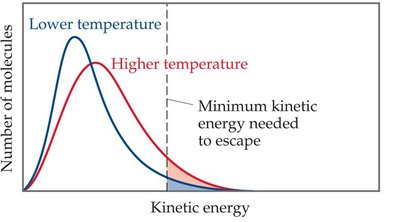
Kinetic Energy Distribution and Temperature
The distribution of kinetic energies among molecules shifts with temperature. At higher temperatures, more molecules have enough energy to escape the liquid phase.
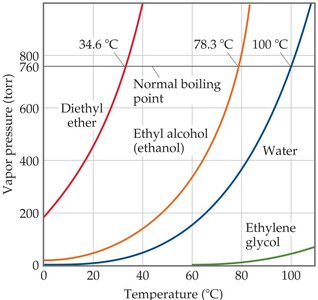
Relationship Between Temperature, Vapor Pressure, and IMFs
As temperature increases, vapor pressure increases.
Small changes in temperature can cause large changes in vapor pressure.
The rate of change depends on the strength of IMFs.

Boiling Point and External Pressure
The boiling point of a liquid decreases as external pressure decreases. For example, water boils at lower temperatures at higher elevations.
Location | Elevation (ft) | Pressure (atm) | Boiling Point (°C) |
|---|---|---|---|
Mount Everest | 29,032 | 0.32 | 78 |
Denali | 20,310 | 0.46 | 83 |
Mount Whitney | 14,505 | 0.60 | 87 |
Denver | 5,280 | 0.83 | 94 |
Boston (sea level) | 20 | 1.0 | 100 |
Effect of IMFs on Vapor Pressure and Boiling Point
Stronger IMFs result in lower vapor pressure and higher boiling point.
Weaker IMFs result in higher vapor pressure and lower boiling point.
Volatile compounds have weak IMFs, high vapor pressure, and low boiling points.
Nonvolatile compounds have strong IMFs, low vapor pressure, and high boiling points.
Comparing Compounds: Dimethyl Ether vs. Ethanol
Dimethyl ether and ethanol are isomers with identical molar masses, but ethanol has hydrogen bonding (HB), the strongest IMF. Therefore, ethanol has lower vapor pressure and higher boiling point.
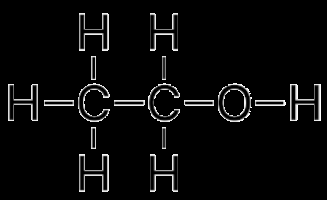
Comparing Compounds: Water vs. Ethanol
Water has more extensive hydrogen bonding than ethanol, resulting in a higher boiling point.
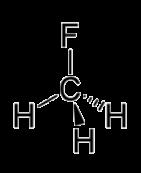
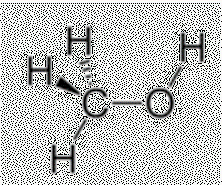
Comparing Compounds: Methanol vs. Fluoromethane
Methanol (CH3OH) has a higher boiling point than fluoromethane (CH3F) due to stronger hydrogen bonding, despite similar molar masses and dipole moments.
Predicting Boiling Points: Alcohols
Among alcohols, lower molar mass means weaker London dispersion forces (LDFs) and lower boiling point. Methanol boils at 64.6°C, lower than ethanol (78.3°C).
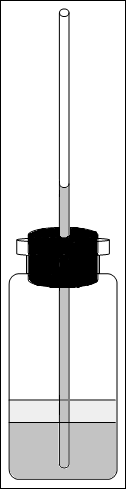
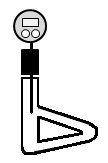
Laboratory: Measuring Vapor Pressure and Boiling Point
Experiments can be conducted to measure vapor pressures and boiling points of a homologous series of alcohols using specialized apparatus.
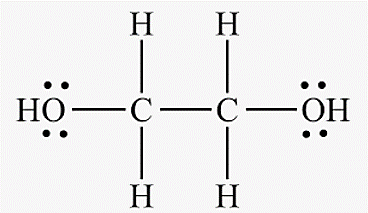
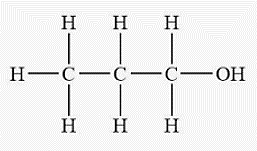
Comparing Physical Properties: Ethylene Glycol vs. Propanol
Physical Property | HOCH2CH2OH | CH3CH2CH2OH |
|---|---|---|
Greater surface tension | HOCH2CH2OH | |
Lower viscosity | CH3CH2CH2OH | |
Higher boiling point | HOCH2CH2OH | |
Higher vapor pressure | CH3CH2CH2OH |
The Clausius-Clapeyron Equation
Mathematical Relationship
The Clausius-Clapeyron equation describes the exponential relationship between vapor pressure and temperature:
Taking the natural logarithm yields a linear relationship:
Where , is in Kelvins, and is in J/mol.
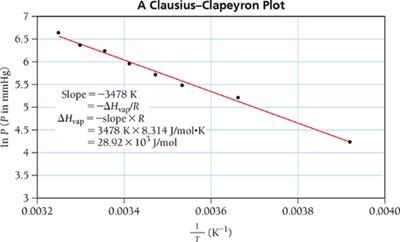
Two-Point Form
For two vapor pressures measured at two temperatures:
This form allows calculation of vapor pressure at any temperature, or determination of from experimental data.
Example Calculations
Calculate vapor pressure at a given temperature using known and boiling point.
Calculate from vapor pressures at two temperatures.
Phase Changes and Phase Diagrams
Types of Phase Changes
Phase changes are physical changes involving the addition or removal of heat:
Endothermic: Melting (fusion), vaporization, sublimation
Exothermic: Freezing, condensation, deposition
Thermodynamic Quantities
Molar heat of vaporization (ΔHvap): Heat needed to vaporize one mole at boiling point (always positive).
Molar heat of fusion (ΔHfus): Heat needed to melt one mole of solid (smaller than ΔHvap).
Molar heat of sublimation (ΔHsub): Heat needed to sublime one mole of solid.
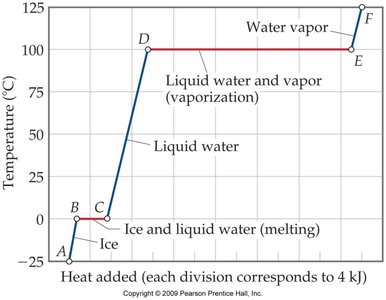
Heating Curve of Water
The heating curve illustrates the energy required for phase changes and temperature increases for one mole of water.
Segment AB: Heating solid ice
Segment BC: Melting ice
Segment CD: Heating liquid water
Segment DE: Vaporizing liquid water
Segment EF: Heating steam


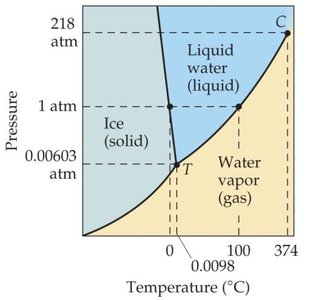
Phase Diagrams
A phase diagram is a graphical representation of the equilibrium between different phases as a function of pressure and temperature. It allows prediction of the phase present under any conditions.
Main regions: solid, liquid, gas
Phase boundaries: lines separating regions, representing equilibrium between phases
Triple point: intersection of all three boundaries, where all phases coexist
Critical point: highest temperature and pressure where liquid and gas are distinguishable
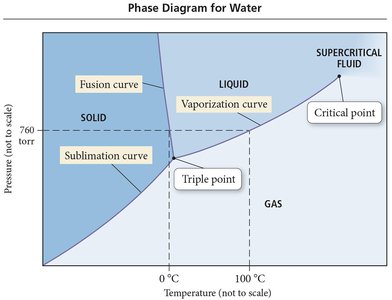
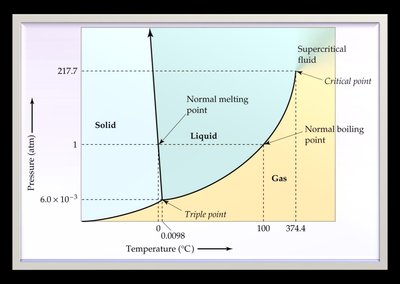
Phase Diagram for Water
Water's phase diagram is unique because the solid/liquid equilibrium line slopes to the left, indicating that ice is less dense than liquid water. The melting point decreases with increasing pressure.
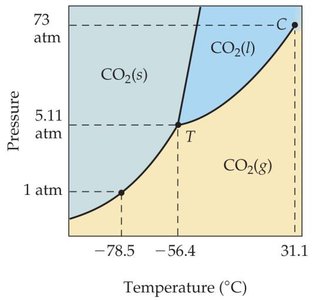
Phase Diagram for Carbon Dioxide
For CO2, the solid/liquid equilibrium line slopes to the right, indicating the solid is denser than the liquid. Below 5.11 atm, CO2 sublimes directly from solid to gas.
Supercritical Fluids
Above the critical point, the liquid and gas phases become indistinguishable, forming a supercritical fluid. Supercritical fluids have high densities and can dissolve large nonvolatile molecules, making them useful in industrial applications such as extraction of caffeine and fragrances.
 Additional info: The notes above expand on the original lecture slides, providing definitions, equations, and examples for clarity and completeness.
