 Back
BackChap 12 lecture 4 study guide chem 136
Study Guide - Smart Notes
 Tailored notes based on your materials, expanded with key definitions, examples, and context.
Solids, Liquids, and Intermolecular Forces
Vapor Pressure and Boiling Point
The physical properties of liquids and solids are strongly influenced by the strength and type of intermolecular forces (IMFs) present. Vapor pressure and boiling point are two key properties that depend on IMFs.
Vapor Pressure: The pressure exerted by a vapor in equilibrium with its liquid at a given temperature. Molecules with sufficient kinetic energy can escape the liquid phase and enter the gas phase, resulting in vaporization.
Boiling Point: The temperature at which the vapor pressure of a liquid equals the external pressure. The normal boiling point is defined at 1 atmosphere (760 torr).
Volatile liquids vaporize easily at ordinary temperatures, while nonvolatile liquids do not.
The rate of vaporization increases with higher temperature, greater surface area, and weaker IMFs.
Solids also exert vapor pressures, but much lower than liquids due to stronger molecular attractions.
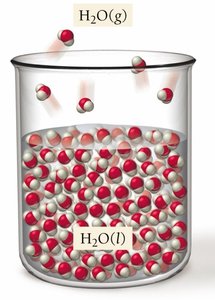
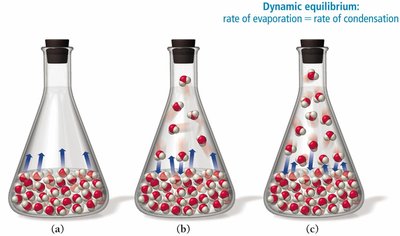
Example: Vaporization in a sealed flask demonstrates the increase in vapor pressure as molecules escape the liquid phase.
Heat of Vaporization
The heat of vaporization () is the energy required to vaporize one mole of a substance at its boiling point. This process is always endothermic (positive $\Delta H_{\text{vap}}$), while condensation is exothermic.
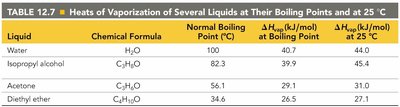
depends on temperature and can be compared for different substances.
Liquid | Chemical Formula | Normal Boiling Point (°C) | at Boiling Point (kJ/mol) | at 25°C (kJ/mol) |
|---|---|---|---|---|
Water | H2O | 100 | 40.7 | 44.0 |
Isopropyl alcohol | C3H8O | 82.3 | 39.9 | 45.4 |
Acetone | C3H6O | 56.1 | 29.1 | 31.0 |
Diethyl ether | C4H10O | 34.6 | 26.5 | 27.1 |
Effect of Temperature on Kinetic Energy Distribution
As temperature increases, the average kinetic energy of molecules increases, and more molecules have enough energy to escape the liquid phase.
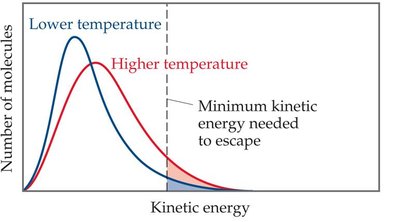
Higher temperature shifts the kinetic energy distribution, increasing the fraction of molecules able to vaporize.
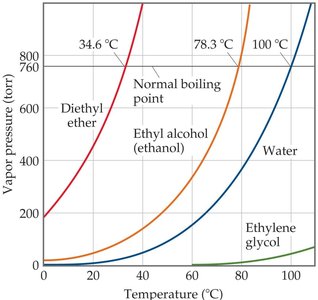
As temperature rises, vapor pressure increases rapidly.
Boiling Point and External Pressure
The boiling point of a liquid decreases as external pressure decreases. For example, water boils at lower temperatures at higher elevations due to reduced atmospheric pressure.
Normal boiling point is at 1 atm (760 torr).
Boiling point varies with location and atmospheric pressure.
Effect of IMFs on Vapor Pressure and Boiling Point
The strength of intermolecular forces determines the vapor pressure and boiling point of a substance.
Strong IMFs: Lower vapor pressure, higher boiling point (nonvolatile).
Weak IMFs: Higher vapor pressure, lower boiling point (volatile).
Boiling points are lowest for compounds with the weakest IMFs.
Comparing IMFs: Examples
Example: Dimethyl ether vs. Ethanol
Both have similar molar masses and are polar, but ethanol has hydrogen bonding (HB), the strongest IMF.
Ethanol has lower vapor pressure and higher boiling point due to stronger IMFs.
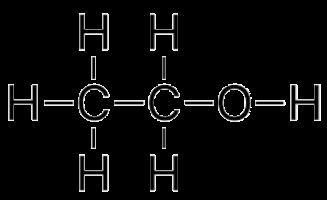
Example: Water vs. Ethanol
Water has more extensive hydrogen bonding, resulting in a higher boiling point than ethanol.
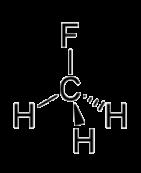
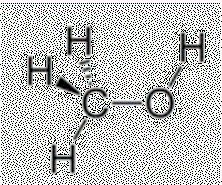
Example: Methanol vs. Fluoromethane
Methanol () has hydrogen bonding, while fluoromethane () does not.
Methanol has a higher boiling point due to stronger IMFs.
Predicting Boiling Points
Boiling points can be predicted based on molecular structure and IMFs. Lower molar mass and weaker IMFs result in lower boiling points.
The Clausius-Clapeyron Equation
Mathematical Relationship
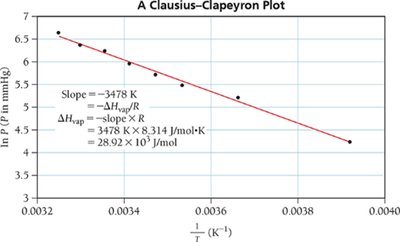
The Clausius-Clapeyron equation describes the exponential relationship between vapor pressure and temperature:
Taking the natural logarithm yields a linear relationship:
A plot of vs. is a straight line, with slope .
Two-Point Form
For two vapor pressures and at temperatures and :
This form is used to calculate vapor pressure at any temperature, or to determine from experimental data.
Phase Changes and Phase Diagrams
Phase Changes
Phase changes are physical transformations between solid, liquid, and gas, accomplished by the addition or removal of heat.
Endothermic: Melting (fusion), vaporization, sublimation
Exothermic: Freezing, condensation, deposition
Thermodynamic Quantities
Molar heat of vaporization (): Heat needed to vaporize one mole at boiling point (kJ/mol).
Molar heat of fusion (): Heat needed to melt one mole of solid (kJ/mol).
Molar heat of sublimation (): Heat needed to sublime one mole of solid (kJ/mol).
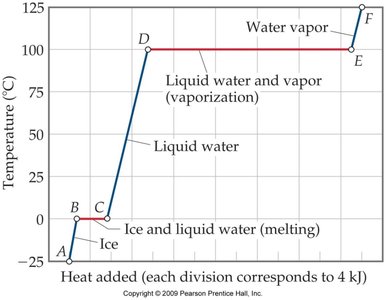
Heating Curve for Water
The heating curve illustrates the temperature changes and phase transitions as heat is added to water.
Segments represent warming of a phase or phase change at constant temperature.
Key equations:
Warming:
Melting:
Vaporization:


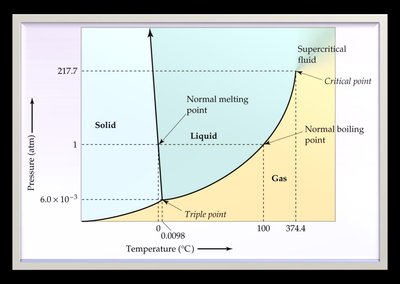
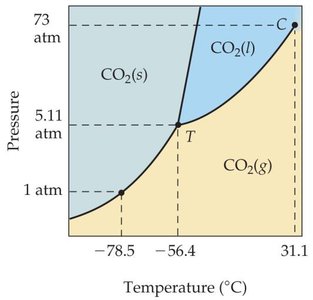
Phase Diagrams
A phase diagram is a graphical summary of the conditions under which equilibria exist between different states of a substance as a function of pressure and temperature.
Regions: Solid, liquid, gas, supercritical fluid
Lines: Phase boundaries (fusion, vaporization, sublimation curves)
Significant points: Triple point (all three phases in equilibrium), critical point (beyond which liquid and gas are indistinguishable)
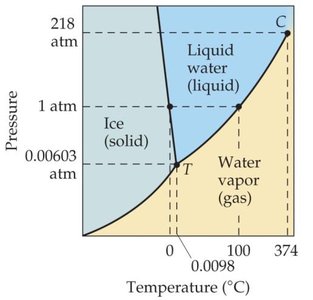
Comparing Phase Diagrams: Water vs. CO2
For most substances, the solid/liquid equilibrium line slopes right (solid denser than liquid).
For water, the line slopes left (solid less dense than liquid), so melting point decreases with increasing pressure.
Supercritical Fluids
Above the critical temperature and pressure, a substance exists as a supercritical fluid, with properties of both liquids and gases. Supercritical fluids can dissolve large nonvolatile molecules and are used in industrial applications such as extraction of caffeine and fragrances.
Additional info: Supercritical fluid carbon dioxide is widely used due to its purity, nonflammability, and nontoxicity.
