 Back
BackStep-by-Step Guidance for CHEM 1020-01 Practice Exam 1 (Spring 2026)
Study Guide - Smart Notes
 Tailored notes based on your materials, expanded with key definitions, examples, and context.
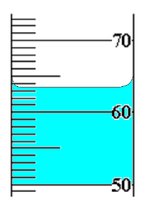
Q3. Read the measurement to the correct number of significant figures in the following laboratory glassware.
Background
Topic: Measurement and Significant Figures
This question tests your ability to correctly interpret a laboratory measurement and report it with the proper number of significant figures, which is essential for accuracy in scientific data.
Key Terms:
Significant Figures: The digits in a measurement that are known with certainty plus one digit that is estimated.
Meniscus: The curve seen at the liquid's surface; always read from the bottom of the meniscus at eye level.
Step-by-Step Guidance
Examine the graduated cylinder and identify the scale increments (each major line represents 10 units, and minor lines represent 1 unit).
Locate the bottom of the meniscus and determine which minor line it is closest to.
Estimate the value between the minor lines if the meniscus falls between them, and add this as the uncertain digit.
Report the measurement using all certain digits plus one estimated digit, ensuring the correct number of significant figures.
Try solving on your own before revealing the answer!
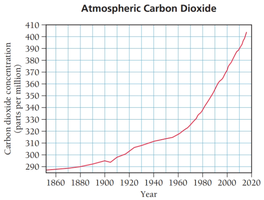
Q9. The graph below shows the concentration in ppm (parts per million) of CO2 in the atmospheric air since the year 1850. What was the CO2 concentration in 1990?
Background
Topic: Data Interpretation and Environmental Chemistry
This question tests your ability to read and interpret scientific graphs, specifically relating to atmospheric carbon dioxide levels over time.
Key Terms:
ppm (parts per million): A unit of concentration often used for gases in the atmosphere.
Trend Analysis: Observing how values change over time in a graph.
Step-by-Step Guidance
Locate the year 1990 on the x-axis of the graph.
Follow the vertical line from 1990 up to where it intersects the CO2 concentration curve.
Read the corresponding value on the y-axis (CO2 concentration in ppm).
Estimate the value as accurately as possible, considering the scale and grid lines.
Try solving on your own before revealing the answer!
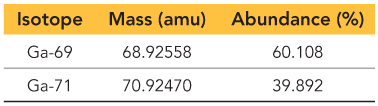
Q19. Gallium has two naturally occurring isotopes with the following masses and natural abundances. What is the atomic mass of Ga? Your answer must have the correct number of significant figures.
Background
Topic: Isotopes and Atomic Mass Calculation
This question tests your ability to calculate the weighted average atomic mass of an element based on its isotopic composition.
Key Terms and Formula:
Isotope: Atoms of the same element with different numbers of neutrons.
Atomic Mass: The weighted average mass of all isotopes of an element.
Key formula:
Step-by-Step Guidance
Convert the percent abundance of each isotope to a decimal (fractional abundance).
Multiply the mass of each isotope by its fractional abundance.
Add the results from each isotope to get the weighted average atomic mass.
Ensure your answer has the correct number of significant figures based on the data provided.
Try solving on your own before revealing the answer!
