Skip to main content
Genetics
My Course
Learn
Exam Prep
AI Tutor
Study Guides
Textbook Solutions
Flashcards
Explore
Try the app
My Course
Learn
Exam Prep
AI Tutor
Study Guides
Textbook Solutions
Flashcards
Explore
Try the app
Back
Mathematical Measurements definitions
You can tap to flip the card.
Phenotype
You can tap to flip the card.
👆
Phenotype
Observable trait or characteristic measured and analyzed in genetic studies, such as height, weight, or spot number.
Track progress
Control buttons has been changed to "navigation" mode.
1/13
Related flashcards
Related practice
Recommended videos
Mathematical Measurements quiz #1
Mathematical Measurements
10 Terms
Mathematical Measurements
20. Quantitative Genetics
3 problems
Topic
Nicole
Traits and Variance
20. Quantitative Genetics
7 problems
Topic
Kylia
20. Quantitative Genetics
5 topics
14 problems
Chapter
Nicole
Guided course
11:06
Mathematical Measurements
870
views
4
rank
Terms in this set (13)
Hide definitions
Phenotype
Observable trait or characteristic measured and analyzed in genetic studies, such as height, weight, or spot number.
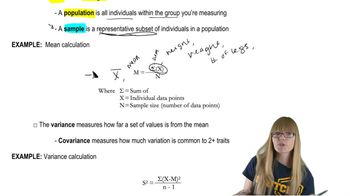
Population
Entire group of individuals being measured, like all humans in a region or all members of a species.
Sample
Representative subset of a population used to estimate characteristics when measuring the whole group is impractical.
Population Mean
Average value calculated from all individuals in a group, reflecting the central tendency of a trait.
Sample Mean
Average value derived from a subset, used to estimate the central tendency of the entire population.
Variance
Quantifies how much individual values differ from the mean, indicating the spread of a trait in a group.
Covariance
Measures the degree to which two traits vary together within a group, revealing shared variation.
Standard Deviation
Indicates the typical amount by which values differ from the mean, derived as the square root of variance.
Standard Error
Estimates the accuracy of a sample mean by considering how well it represents the entire population.
Normal Distribution
Bell-shaped curve showing how trait values are distributed, with most values clustering around the mean.
Frequency Histogram
Graphical representation displaying how often different values of a trait occur within a dataset.
Range
Span between the lowest and highest values observed for a trait, indicating the extent of variation.
Trait
Specific measurable characteristic, such as tail length or head size, analyzed in genetic studies.
 BackBack

 11:06
11:06