 Back
BackIntroductory Chemistry Final Exam Review – Comprehensive Study Notes
Study Guide - Smart Notes
 Tailored notes based on your materials, expanded with key definitions, examples, and context.
The Chemical World
The Scientific Method
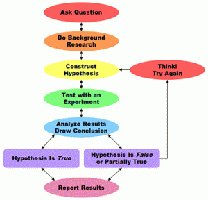
The scientific method is a systematic approach to understanding the natural world through observation, experimentation, and analysis. It is foundational to all scientific inquiry and ensures that knowledge is based on evidence and logical reasoning.
Observation: Gathering information using the senses or instruments.
Hypothesis: A tentative explanation for an observation.
Experiment: Testing the hypothesis under controlled conditions.
Analysis and Conclusion: Interpreting data to support or refute the hypothesis.
Revision: If results do not support the hypothesis, revise and retest.
Matter and Energy
Classification of Matter by Composition
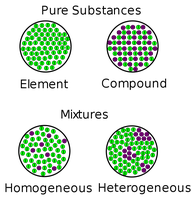
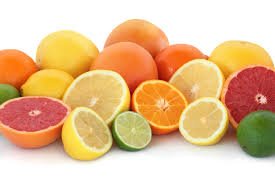
Matter can be classified based on its composition into elements, compounds, and mixtures. Understanding these categories is essential for studying chemical properties and reactions.
Element: A pure substance made of only one type of atom (e.g., O2).
Molecule: Two or more atoms chemically bonded together (e.g., O2, CO2).
Compound: A substance composed of two or more elements in fixed proportions (e.g., H2O).
Homogeneous mixture: Uniform composition throughout (e.g., saltwater).
Heterogeneous mixture: Non-uniform composition (e.g., salad).
Physical and Chemical Properties and Changes
Properties and changes of matter are classified as physical or chemical:
Physical property: Observed without changing composition (e.g., color, boiling point).
Chemical property: Observed only by changing composition (e.g., flammability).
Physical change: Alters form, not composition (e.g., melting ice).
Chemical change: Produces new substances (e.g., rusting iron).
Measurement and Problem Solving
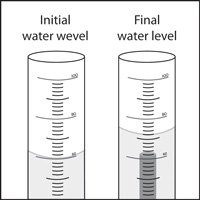
Significant Figures in Measurement
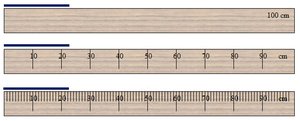
Significant figures reflect the precision of a measurement. The last digit is always an estimate, and different measuring devices provide different levels of precision.
Always estimate one place beyond the smallest marked unit.
More marks on a ruler or device allow for more significant figures.
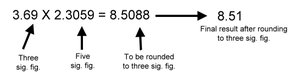
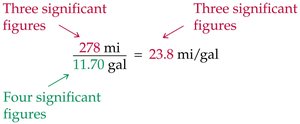
Significant Figures in Calculations
Multiplication/Division: The result has as many significant figures as the factor with the fewest significant figures.
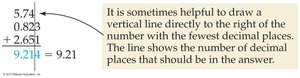
Addition/Subtraction: The result has as many decimal places as the number with the fewest decimal places.
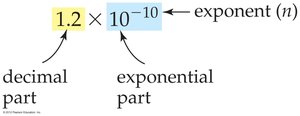
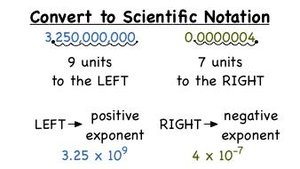
Scientific Notation
Scientific notation expresses very large or small numbers in the form $a \times 10^n$, where $1 \leq a < 10$ and $n$ is an integer. It clarifies significant figures and simplifies calculations.
All digits in the decimal part are significant.
Use for numbers with many zeros or unclear significance of zeros.
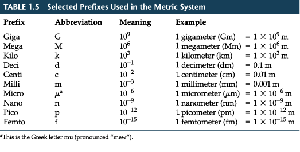
SI (Metric) Units and Prefixes
The International System of Units (SI) uses base units and prefixes to indicate multiples or fractions of units. Common prefixes include kilo-, centi-, and milli-.
Prefix | Abbreviation | Meaning | Example |
|---|---|---|---|
Kilo | k | 103 | 1 kilometer (km) = 1,000 m |
Centi | c | 10-2 | 1 centimeter (cm) = 0.01 m |
Milli | m | 10-3 | 1 millimeter (mm) = 0.001 m |
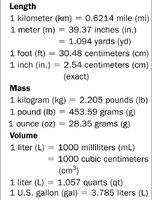
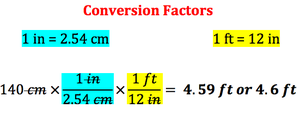
Unit (Dimensional) Analysis
Unit analysis is a systematic method for converting between units using conversion factors. It is essential for solving chemistry problems involving measurements.
Identify the starting unit and the desired unit.
Multiply by conversion factors until the desired unit is reached.
Within-system conversions (e.g., 1 ft = 12 in) have unlimited significant figures; between-system conversions (e.g., 1 in = 2.54 cm) have limited significant figures.
Density
Density is the ratio of mass to volume and is used to identify substances and solve conversion problems.
Formula: $\text{Density} = \frac{\text{Mass}}{\text{Volume}}$
Units: g/mL or g/cm3 for solids and liquids; g/L for gases.
Can be used as a conversion factor between mass and volume.

Atoms and Elements
Atomic Notation
Atoms are described by their atomic number (number of protons), mass number (protons + neutrons), and charge (protons - electrons). The atomic number determines the element's identity.
Notation: $^{A}_{Z}\text{X}$, where A = mass number, Z = atomic number, X = element symbol.
Isotopes: Atoms of the same element with different numbers of neutrons.
Valence Electrons and Ions
Valence electrons are the outermost electrons and determine chemical reactivity. Atoms gain or lose electrons to achieve a full outer shell, forming ions.
Cation: Positive ion (lost electrons).
Anion: Negative ion (gained electrons).
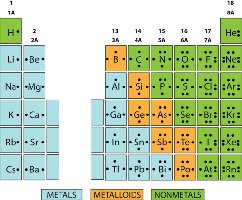
Metals tend to lose electrons; nonmetals tend to gain electrons.
Electron Configuration
Electron configuration describes the arrangement of electrons in an atom. Electrons fill sublevels in order of increasing energy, following the Aufbau principle.
Use the periodic table to assign electrons to sublevels (s, p, d, f).
Ions have the same electron configuration as the nearest noble gas.
Chemical Composition
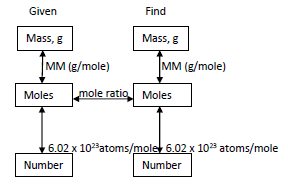
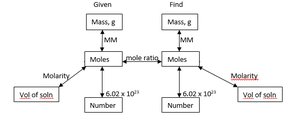
Converting Between Mass, Moles, and Number of Particles
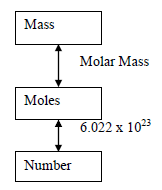
Chemists use the mole as a counting unit. Avogadro's number ($6.022 \times 10^{23}$) relates moles to number of particles.
Mass ↔ Moles: $\text{Moles} = \frac{\text{Mass}}{\text{Molar Mass}}$
Moles ↔ Number: $\text{Number of particles} = \text{Moles} \times 6.022 \times 10^{23}$
Percent Composition
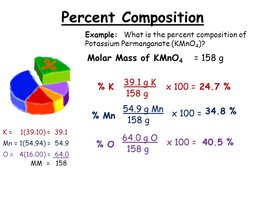
Percent composition expresses the mass percentage of each element in a compound.
Formula: $\%\,\text{Element} = \frac{\text{Mass of element in 1 mole}}{\text{Molar mass of compound}} \times 100\%$
Empirical and Molecular Formulas
Empirical formula: Simplest whole-number ratio of elements in a compound.
Molecular formula: Actual number of atoms of each element in a molecule.
To find empirical formula: Convert mass to moles, divide by smallest, round to whole numbers.
To find molecular formula: Divide molar mass by empirical formula mass, multiply subscripts.
Chemical Reactions
Balancing Chemical Equations
Balancing equations ensures the law of conservation of mass is obeyed. Each side must have the same number of each type of atom.
Write correct formulas for reactants and products.
Add coefficients to balance atoms.
Balance polyatomic ions as units if they appear unchanged on both sides.
Types of Chemical Reactions
Single Displacement: One element replaces another in a compound.
Double Displacement: Exchange of ions between two compounds.
Combustion: Reaction with O2, producing CO2 and H2O (for hydrocarbons).


Stoichiometry
Stoichiometry involves quantitative relationships in chemical reactions, using mole ratios from balanced equations to calculate amounts of reactants and products.
Steps: Balance equation, convert given to moles, use mole ratio, convert to desired unit.
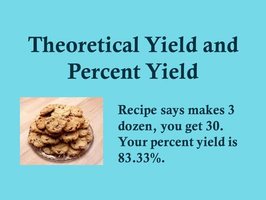
Theoretical Yield, Actual Yield, and Percent Yield
Theoretical yield: Maximum amount of product predicted by stoichiometry.
Actual yield: Amount actually obtained from experiment.
Percent yield: $\frac{\text{Actual yield}}{\text{Theoretical yield}} \times 100\%$
Chemical Bonding
Lewis Dot Diagrams
Lewis dot diagrams represent valence electrons and help visualize bonding in molecules. Follow a stepwise process to draw them for molecules and ions.
Count total valence electrons (adjust for charge).
Arrange atoms (least electronegative in center, H never in center).
Connect with single bonds, complete octets, form multiple bonds if needed.
Resonance structures exist if multiple valid diagrams are possible.
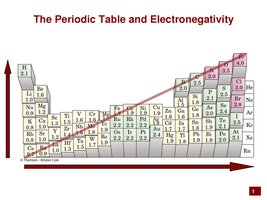
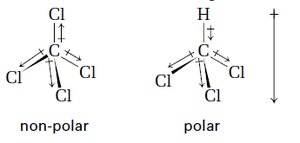
Bond Polarity and Molecular Polarity
Bonds are polar if there is a significant difference in electronegativity between atoms. Molecular polarity depends on both bond polarity and molecular shape.
Nonpolar bonds: Equal sharing of electrons (e.g., O2).
Polar bonds: Unequal sharing (e.g., H2O).
Symmetrical molecules (tetrahedral, trigonal planar, linear) with identical surrounding atoms are nonpolar.
Asymmetrical shapes (bent, trigonal pyramidal) or different surrounding atoms lead to polar molecules.
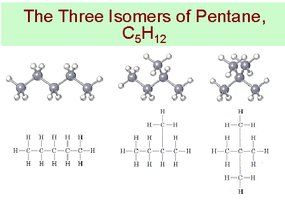
Isomers
Isomers are compounds with the same molecular formula but different structures, resulting in different physical and chemical properties.
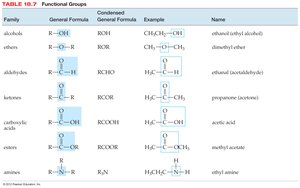
Naming Hydrocarbons and Functional Groups
Hydrocarbons are named based on the longest carbon chain and the presence of double or triple bonds. Functional groups determine the chemical properties of organic molecules.
Liquids, Solids, and Intermolecular Forces
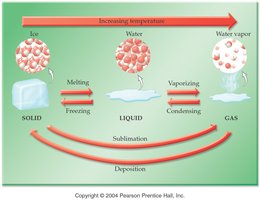
Phase Changes
Phase changes involve transitions between solid, liquid, and gas states. Energy is absorbed or released during these changes.
Solutions
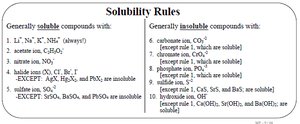
Types of Solutions and Solubility
Solubility depends on the nature of solute and solvent, temperature, and pressure. "Like dissolves like"—polar solutes dissolve in polar solvents, nonpolar in nonpolar.
Gas solubility in liquids increases with pressure and decreases with temperature.
Measuring Concentration
Mass percent: $\frac{\text{g solute}}{\text{g solute} + \text{g solvent}} \times 100\%$
Molarity (M): $\frac{\text{moles solute}}{\text{liters solution}}$
Dilution: $M_1V_1 = M_2V_2$ (moles of solute remain constant)
Solution Stoichiometry
Use volume and molarity to find moles, then apply stoichiometry as with other reactions.
Acids and Bases
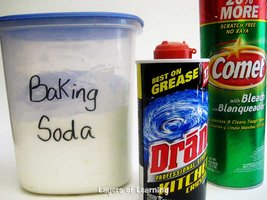
Properties of Acids and Bases
Acids: Sour taste, dissolve metals, turn blue litmus red.
Bases: Bitter taste, slippery feel, turn red litmus blue.

pH Scale
The pH scale measures the acidity or basicity of a solution. It is calculated as $pH = -\log[H^+]$.
pH < 7: Acidic
pH = 7: Neutral
pH > 7: Basic

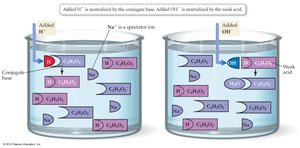
Buffers
Buffers are solutions that resist changes in pH when small amounts of acid or base are added. They contain a weak acid and its conjugate base.

Gases
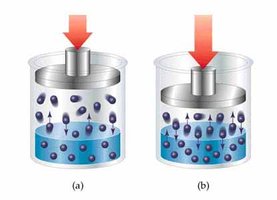
Kinetic Molecular Theory and Properties of Gases
The kinetic molecular theory explains the behavior of ideal gases: constant motion, negligible volume, no intermolecular forces, and elastic collisions. Real gases behave ideally at high temperature and low pressure.
Ideal Gas Law
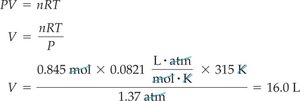
The ideal gas law relates pressure, volume, temperature, and amount of gas:
$PV = nRT$
P = pressure (atm), V = volume (L), n = moles, R = 0.0821 L·atm/(mol·K), T = temperature (K)
Always convert temperature to Kelvin: $K = ^\circ C + 273.15$
Stoichiometry with Gases
At STP (0°C, 1 atm), 1 mole of gas occupies 22.4 L.
Use gas volume in stoichiometry problems as another way to relate moles and quantities.
Radioactivity and Nuclear Chemistry
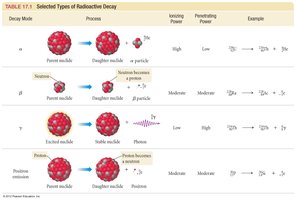
Types of Radioactive Decay
Alpha decay: Emission of a helium nucleus ($^4_2He$).
Beta decay: Conversion of a neutron to a proton with emission of an electron ($^0_{-1}e$).
Positron emission: Conversion of a proton to a neutron with emission of a positron ($^0_{+1}e$).
Half-Life Calculations
The half-life of a radioactive isotope is the time required for half of a sample to decay. Use a table or formula to determine the remaining amount after a given time.
After each half-life, divide the remaining amount by 2.
Additional info: These notes are structured to cover all major topics in an introductory college chemistry course, with expanded academic context and relevant images to reinforce key concepts.
