Ch. 4 - Applications of the Derivative
Briggs - Calculus: Early Transcendentals 3rd Edition
Briggs3rd EditionCalculus: Early TranscendentalsISBN: 9780136847243Non è quello che usi tu?Cambia libro di testo
Capitolo 4, Problema 4.4.49

49–54. {Use of Tech} Graphing with technology Make a complete graph of the following functions. A graphing utility is useful in locating intercepts, local extreme values, and inflection points.


ƒ(x) = 1/3 x³ - 2x² - 5x + 2

Guida verificata passo dopo passo
1
Start by identifying the function you need to graph: \( f(x) = \frac{1}{3}x^3 - 2x^2 - 5x + 2 \). This is a cubic polynomial function.
Use a graphing utility or software to input the function. This will help you visualize the graph and identify key features such as intercepts, local extrema, and inflection points.
Locate the x-intercepts by setting \( f(x) = 0 \) and solving the equation \( \frac{1}{3}x^3 - 2x^2 - 5x + 2 = 0 \). Use the graphing tool to approximate these values.
Identify the local extrema by finding the derivative \( f'(x) \) and setting it to zero to find critical points. The derivative is \( f'(x) = x^2 - 4x - 5 \). Solve \( x^2 - 4x - 5 = 0 \) to find critical points, and use the second derivative test or the graph to determine if they are maxima or minima.
Determine the inflection points by finding the second derivative \( f''(x) \) and setting it to zero. The second derivative is \( f''(x) = 2x - 4 \). Solve \( 2x - 4 = 0 \) to find potential inflection points, and verify by checking the change in concavity on the graph.

Risposta video verificata per un problema simile:

Questa soluzione video è stata consigliata dai nostri tutor come utile per risolvere questo problema.
Durata del video:
17m

Concetti chiave

Ecco i concetti essenziali che devi comprendere per rispondere correttamente alla domanda.

Graphing Functions

Graphing functions involves plotting the curve of a function on a coordinate plane to visualize its behavior. This includes identifying key features such as intercepts, where the graph crosses the axes, and understanding the overall shape and direction of the graph. Graphing utilities, like graphing calculators or software, can assist in accurately plotting complex functions.
Video consigliato:
Percorso guidato
5:53
Graph of Sine and Cosine Function

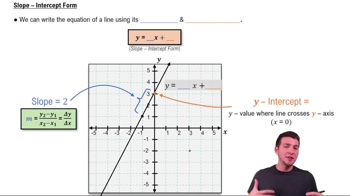
Intercepts

Intercepts are points where the graph of a function crosses the axes. The x-intercepts are found by setting the function equal to zero and solving for x, while the y-intercept is found by evaluating the function at x = 0. These points are crucial for understanding the function's behavior and are often used as starting points for sketching graphs.
Video consigliato:
3:56
Slope-Intercept Form

Local Extreme Values and Inflection Points

Local extreme values are points where a function reaches a local maximum or minimum. These can be found using the first derivative test. Inflection points occur where the function changes concavity, identified using the second derivative. Both concepts are essential for understanding the function's shape and behavior, especially when graphing.
Video consigliato:
05:12
Finding Global Extrema (Extreme Value Theorem)