Ch. 4 - Applications of Derivatives
Hass - Thomas' Calculus 15th Edition
Hass15th EditionThomas' CalculusISBN: 9780137616077Non è quello che usi tu?Cambia libro di testo
Capitolo 4, Problema 4.4.106d

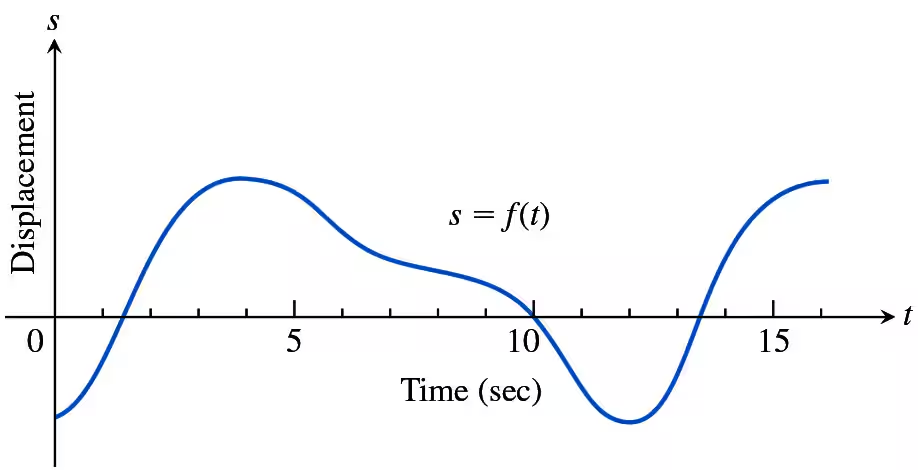
106. Motion Along a Line The graphs in Exercises 105 and 106 show the position s=f(t) of an object moving up and down on a coordinate line. At approximately what times is the (d) When is the acceleration positive? Negative?
Graph showing displacement over time, illustrating an object's motion along a line with peaks and troughs.

Guida verificata passo dopo passo
1
To determine when the acceleration is positive or negative, we need to analyze the concavity of the position function s=f(t). Acceleration is the second derivative of the position function, so we are looking for intervals where the graph is concave up (positive acceleration) and concave down (negative acceleration).
Identify the intervals where the graph of s=f(t) is concave up. This occurs when the graph is curving upwards, resembling a U-shape. In these intervals, the second derivative is positive, indicating positive acceleration.
Identify the intervals where the graph of s=f(t) is concave down. This occurs when the graph is curving downwards, resembling an upside-down U-shape. In these intervals, the second derivative is negative, indicating negative acceleration.
Examine the graph closely to find the points of inflection, where the concavity changes. These are the points where the acceleration changes from positive to negative or vice versa.
Using the graph, estimate the time intervals for positive and negative acceleration by observing the changes in concavity. Note these intervals as approximate times where the acceleration is positive or negative.

Risposta video verificata per un problema simile:

Questa soluzione video è stata consigliata dai nostri tutor come utile per risolvere questo problema.
Durata del video:
2m

Concetti chiave

Ecco i concetti essenziali che devi comprendere per rispondere correttamente alla domanda.

Position Function

The position function, denoted as s = f(t), describes the location of an object along a coordinate line at any given time t. It is a fundamental concept in motion analysis, allowing us to understand how the object's position changes over time. The graph of this function visually represents the object's trajectory, with peaks indicating maximum displacement and troughs indicating minimum displacement.
Video consigliato:
Percorso guidato
5:20
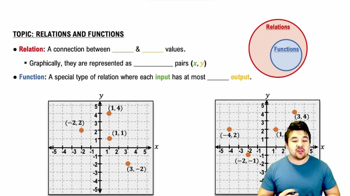
Relations and Functions

Velocity

Velocity is the rate of change of the position function with respect to time, mathematically expressed as v(t) = f'(t). It indicates both the speed and direction of the object's motion. When analyzing the graph, the velocity is positive when the graph is increasing and negative when it is decreasing, providing insights into the object's movement along the line.
Video consigliato:
Percorso guidato
06:29
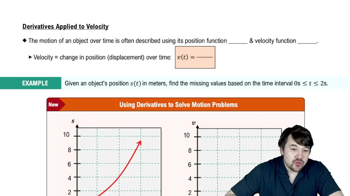
Derivatives Applied To Velocity

Acceleration

Acceleration is the rate of change of velocity with respect to time, represented as a(t) = v'(t) = f''(t). It indicates how quickly the object's velocity is changing, which can be positive (speeding up) or negative (slowing down). In the context of the graph, acceleration is positive when the slope of the velocity function is increasing and negative when it is decreasing, helping to determine the object's motion dynamics.
Video consigliato:
Percorso guidato
06:15
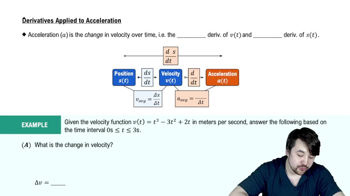
Derivatives Applied To Acceleration