Ch. 2 - Functions and Graphs
Blitzer - College Algebra 8th Edition
Blitzer8th EditionCollege AlgebraISBN: 9780136970514Non è quello che usi tu?Cambia libro di testo
Capitolo 3, Problema 57

In Exercises 55–59, use the graph of to graph each function g. Graph showing the transformation of g(x) = -f(2x) with x and y axes labeled.
g(x) = -f(2x)

Guida verificata passo dopo passo
1
Identify the original function f(x) from the given graph.
Apply the horizontal compression by a factor of 2 to the function f(x) to get f(2x). This means you will compress the graph horizontally by a factor of 2.
Reflect the graph of f(2x) over the x-axis to get -f(2x). This means you will invert the graph vertically.
Plot the new function g(x) = -f(2x) using the transformations applied in the previous steps.
Verify the transformations by comparing key points from the original graph to the transformed graph.

Risposta video verificata per un problema simile:

Questa soluzione video è stata consigliata dai nostri tutor come utile per risolvere questo problema.
Durata del video:
2m

Concetti chiave

Ecco i concetti essenziali che devi comprendere per rispondere correttamente alla domanda.

Function Transformation

Function transformation refers to the process of altering the graph of a function through various operations, such as shifting, reflecting, stretching, or compressing. In this case, the function g(x) = -f(2x) involves a reflection across the x-axis and a horizontal compression by a factor of 2. Understanding these transformations is crucial for accurately graphing the new function based on the original function f.
Video consigliato:
4:22
Domain & Range of Transformed Functions

Reflection Across the X-Axis

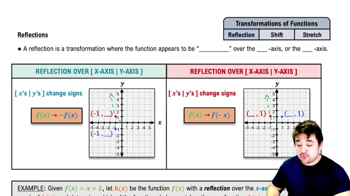
Reflecting a function across the x-axis involves changing the sign of the output values. For the function g(x) = -f(2x), this means that for every point (x, f(x)) on the graph of f, the corresponding point on g will be (x, -f(x)). This transformation results in the graph of g being a mirror image of f with respect to the x-axis, which is essential for visualizing the new function.
Video consigliato:
5:00
Reflections of Functions

Horizontal Compression

Horizontal compression occurs when the input values of a function are scaled by a factor greater than 1, effectively 'squeezing' the graph towards the y-axis. In the function g(x) = -f(2x), the factor of 2 compresses the graph of f horizontally by half. This means that points on the graph of f will be reached more quickly in g, altering the overall shape and behavior of the graph.
Video consigliato:
5:28
Horizontal Parabolas