Ch. 2 - Functions and Graphs
Blitzer - College Algebra 8th Edition
Blitzer8th EditionCollege AlgebraISBN: 9780136970514Non è quello che usi tu?Cambia libro di testo
Capitolo 3, Problema 57a

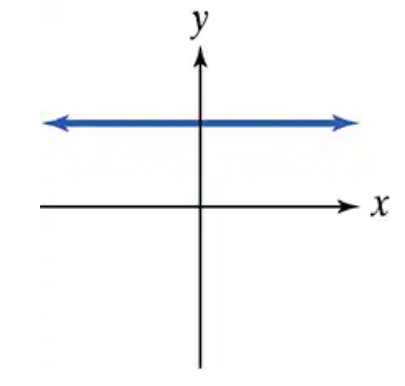
Use the vertical line test to identify graphs in which y is a function of x.

Guida verificata passo dopo passo
1
Step 1: Understand the vertical line test. The vertical line test is a method used to determine if a graph represents a function. If any vertical line intersects the graph at more than one point, then the graph does not represent a function.
Step 2: Observe the graph provided. The graph shows a red curve plotted on a grid with x and y axes labeled. The curve appears to loop and extend outward.
Step 3: Apply the vertical line test. Imagine drawing vertical lines at various x-values across the graph. Check if any vertical line intersects the red curve at more than one point.
Step 4: Analyze intersections. For this graph, vertical lines drawn at certain x-values (e.g., near x = 0) will intersect the curve at two points, indicating that the graph fails the vertical line test.
Step 5: Conclude. Since some vertical lines intersect the graph at more than one point, the graph does not represent y as a function of x.

Risposta video verificata per un problema simile:

Questa soluzione video è stata consigliata dai nostri tutor come utile per risolvere questo problema.
Durata del video:
46s

Concetti chiave

Ecco i concetti essenziali che devi comprendere per rispondere correttamente alla domanda.

Function Definition

A function is a relation between a set of inputs and a set of possible outputs where each input is related to exactly one output. In mathematical terms, for every x-value in the domain, there is a unique y-value in the range. This concept is fundamental in determining whether a graph represents a function.
Video consigliato:
5:57
Graphs of Common Functions

Vertical Line Test

The vertical line test is a method used to determine if a graph represents a function. If any vertical line drawn through the graph intersects it at more than one point, the graph does not represent a function. This test visually confirms the uniqueness of y-values for each x-value.
Video consigliato:
06:49
The Slope of a Line

Graph Interpretation

Interpreting graphs involves understanding the relationship between the x and y coordinates represented visually. It requires analyzing the shape, direction, and intersections of the graph to determine properties such as continuity, limits, and whether it meets the criteria of a function as defined by the vertical line test.
Video consigliato:
02:16
Graphs and Coordinates - Example