Ch. 2 - Functions and Graphs
Blitzer - College Algebra 8th Edition
Blitzer8th EditionCollege AlgebraISBN: 9780136970514Non è quello che usi tu?Cambia libro di testo
Capitolo 3, Problema 87

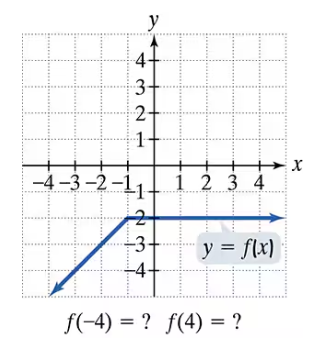
In Exercises 77–92, use the graph to determine a. the function's domain; b. the function's range; c. the x-intercepts, if any; d. the y-intercept, if any; and e. the missing function values, indicated by question marks, below each graph.
Graph showing a piecewise function with a line segment and a horizontal line, missing values at x = -4 and x = 4.

Guida verificata passo dopo passo
1
Step 1: Determine the domain of the function by identifying all the x-values for which the function is defined. Look at the graph and note the starting and ending points along the x-axis where the function exists.
Step 2: Determine the range of the function by identifying all the y-values that the function takes. Observe the lowest and highest points on the graph along the y-axis.
Step 3: Find the x-intercepts by locating points where the graph crosses the x-axis (where y = 0). Check if the graph touches or crosses the x-axis and note those x-values.
Step 4: Find the y-intercept by identifying the point where the graph crosses the y-axis (where x = 0). Note the y-value at this point.
Step 5: To find the missing function values f(-4) and f(4), look at the graph at x = -4 and x = 4. For x = -4, find the corresponding y-value on the graph. For x = 4, observe the horizontal line segment and determine the y-value it holds at that point.

Risposta video verificata per un problema simile:

Questa soluzione video è stata consigliata dai nostri tutor come utile per risolvere questo problema.
Durata del video:
3m

Concetti chiave

Ecco i concetti essenziali che devi comprendere per rispondere correttamente alla domanda.

Domain of a Function

The domain of a function is the set of all possible input values (x-values) for which the function is defined. In a graph, the domain corresponds to the horizontal extent of the graph, including all x-values where the function has points or segments.
Video consigliato:
3:51
Domain Restrictions of Composed Functions

Range of a Function

The range of a function is the set of all possible output values (y-values) that the function can produce. On a graph, the range is the vertical span covered by the function's points or segments, showing all y-values the function attains.
Video consigliato:
4:22
Domain & Range of Transformed Functions

Intercepts and Function Values

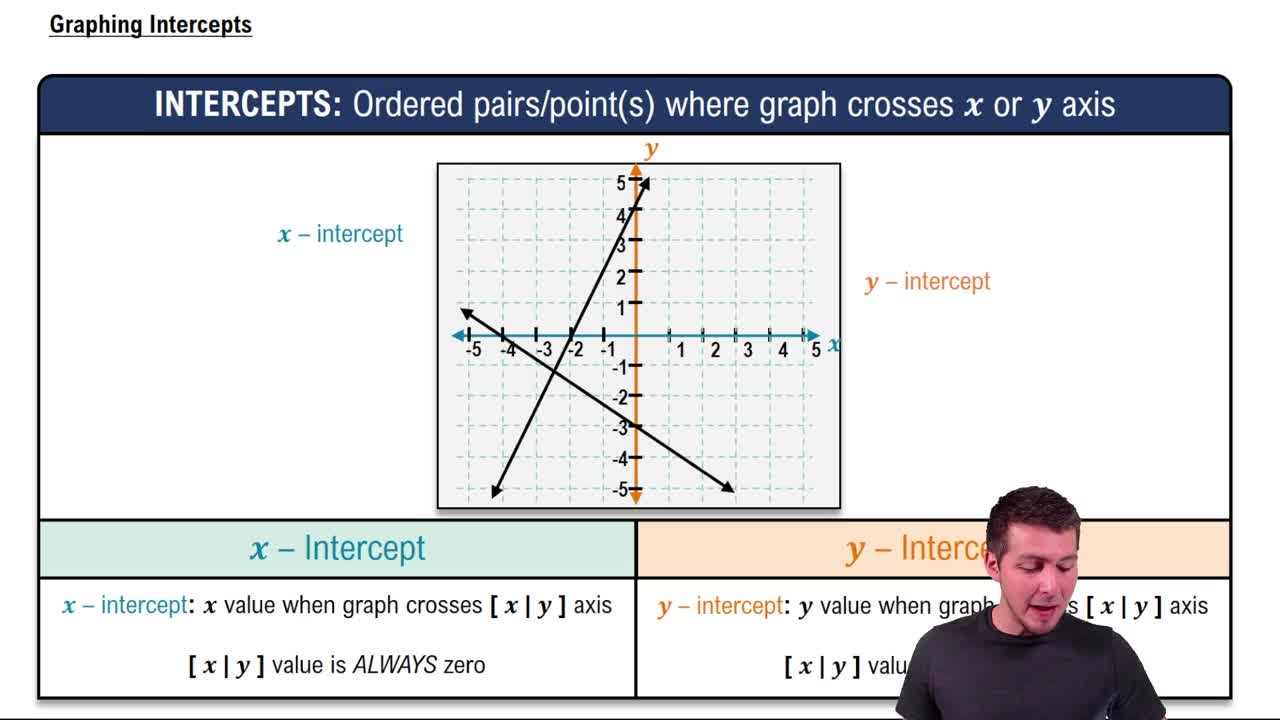
X-intercepts are points where the graph crosses the x-axis (y=0), and y-intercepts are points where the graph crosses the y-axis (x=0). Missing function values at specific x-values can be found by locating those x-values on the graph and reading the corresponding y-values.
Video consigliato:
04:08
Graphing Intercepts