Ch. 2 - Functions and Graphs
Blitzer - College Algebra 8th Edition
Blitzer8th EditionCollege AlgebraISBN: 9780136970514Non è quello che usi tu?Cambia libro di testo
Capitolo 3, Problema 77

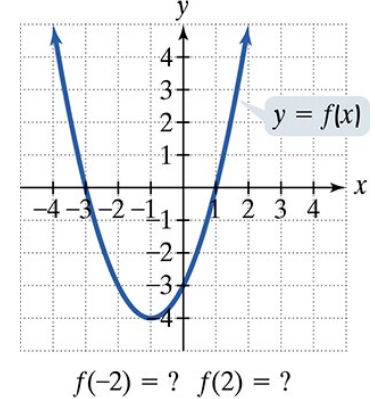
Use the graph to determine a.the x-intercepts, if any; b. the y-intercept, if any; and e. the missing function values, indicated by question marks, below each graph.

Guida verificata passo dopo passo
1
Identify the x-intercepts by finding the points where the graph crosses the x-axis. These points have coordinates where the y-value is 0. From the graph, note the x-values at these points.
Identify the y-intercept by finding the point where the graph crosses the y-axis. This point has coordinates where the x-value is 0. From the graph, note the y-value at this point.
To find the missing function values indicated by question marks, look at the corresponding x-values below the graph and trace vertically to the graph line to find the y-values.
Use the coordinates of the points on the graph to write down the function values for the missing points. Remember that the function value at a given x is the y-coordinate of the point on the graph at that x.
Summarize the results: list the x-intercepts, the y-intercept, and the missing function values clearly, using the coordinates you identified from the graph.

Risposta video verificata per un problema simile:

Questa soluzione video è stata consigliata dai nostri tutor come utile per risolvere questo problema.
Durata del video:
3m

Concetti chiave

Ecco i concetti essenziali che devi comprendere per rispondere correttamente alla domanda.

X-Intercepts

X-intercepts are points where the graph crosses the x-axis, meaning the y-value is zero. Identifying these points helps determine the roots or solutions of the function. In the graph, the x-intercepts are at (-8, 0) and (10, 0).
Video consigliato:
04:08
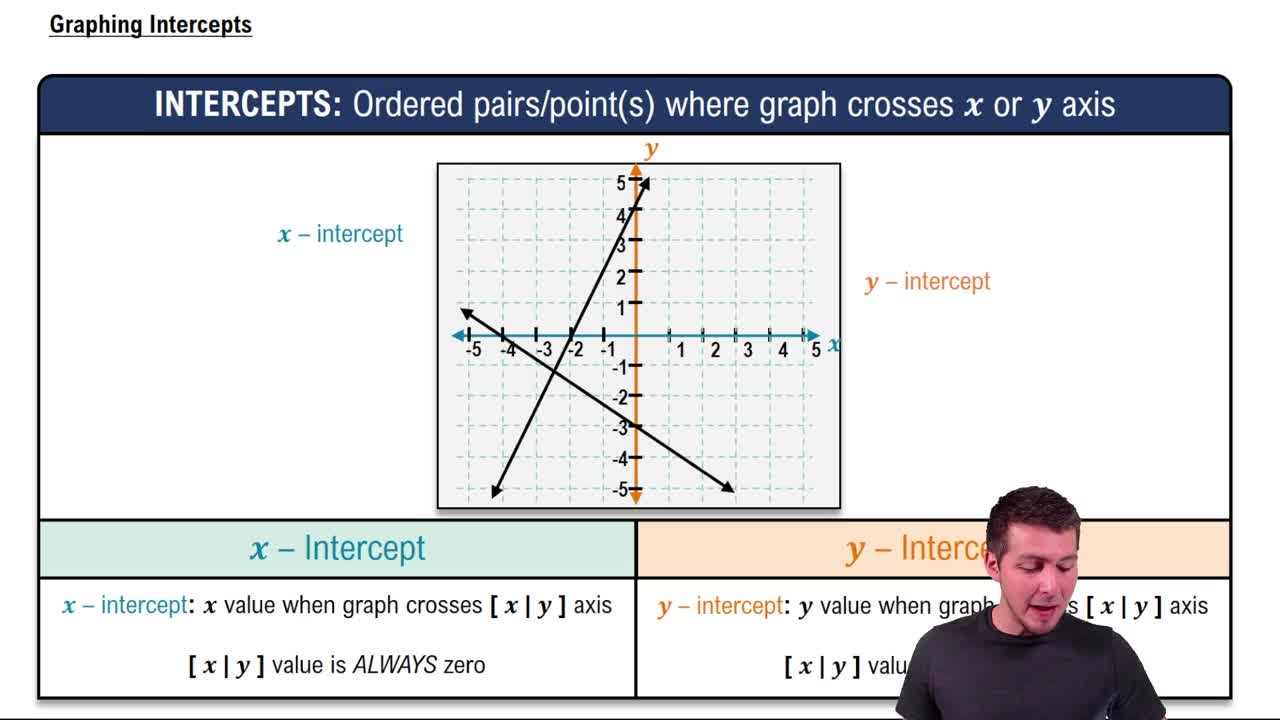
Graphing Intercepts

Y-Intercept

The y-intercept is the point where the graph crosses the y-axis, where the x-value is zero. This point represents the function's value when the input is zero. In the graph, the y-intercept is at (0, 8).
Video consigliato:
04:08
Graphing Intercepts

Reading and Interpreting Graphs

Understanding how to read graphs involves identifying key points, such as intercepts and function values, and interpreting missing values based on the graph's shape and trends. This skill is essential for solving problems involving graphical data.
Video consigliato:
02:16
Graphs and Coordinates - Example