Express the given function h as a composition of two functions ƒ and g so that h(x) = (fog) (x). h(x) = ∛(x² – 9)
Ch. 2 - Functions and Graphs

Capitolo 3, Problema 77
In Exercises 77–92, use the graph to determine a.the x-intercepts, if any; b. the y-intercept, if any; and e. the missing function values, indicated by question marks, below each graph.

Guida verificata passo dopo passo1
Step 1: Identify the x-intercepts of the graph. The x-intercepts are the points where the graph crosses the x-axis. From the graph, these points are (-8, 0) and (10, 0).
Step 2: Identify the y-intercept of the graph. The y-intercept is the point where the graph crosses the y-axis. From the graph, this point is (0, 8).
Step 3: Analyze the missing function values indicated by question marks. For each missing value, locate the corresponding x-coordinate on the graph and determine the y-coordinate by observing the graph's behavior at that point.
Step 4: For example, if a missing value corresponds to x = 0, the y-coordinate is 8, as determined from the graph. Similarly, if a missing value corresponds to x = -8 or x = 10, the y-coordinate is 0.
Step 5: Summarize the findings: The x-intercepts are (-8, 0) and (10, 0), the y-intercept is (0, 8), and the missing function values can be determined by observing the graph at the specified x-coordinates.

Risposta video verificata per un problema simile:
Questa soluzione video è stata consigliata dai nostri tutor come utile per risolvere questo problema.
Durata del video:
2mConcetti chiave
Ecco i concetti essenziali che devi comprendere per rispondere correttamente alla domanda.
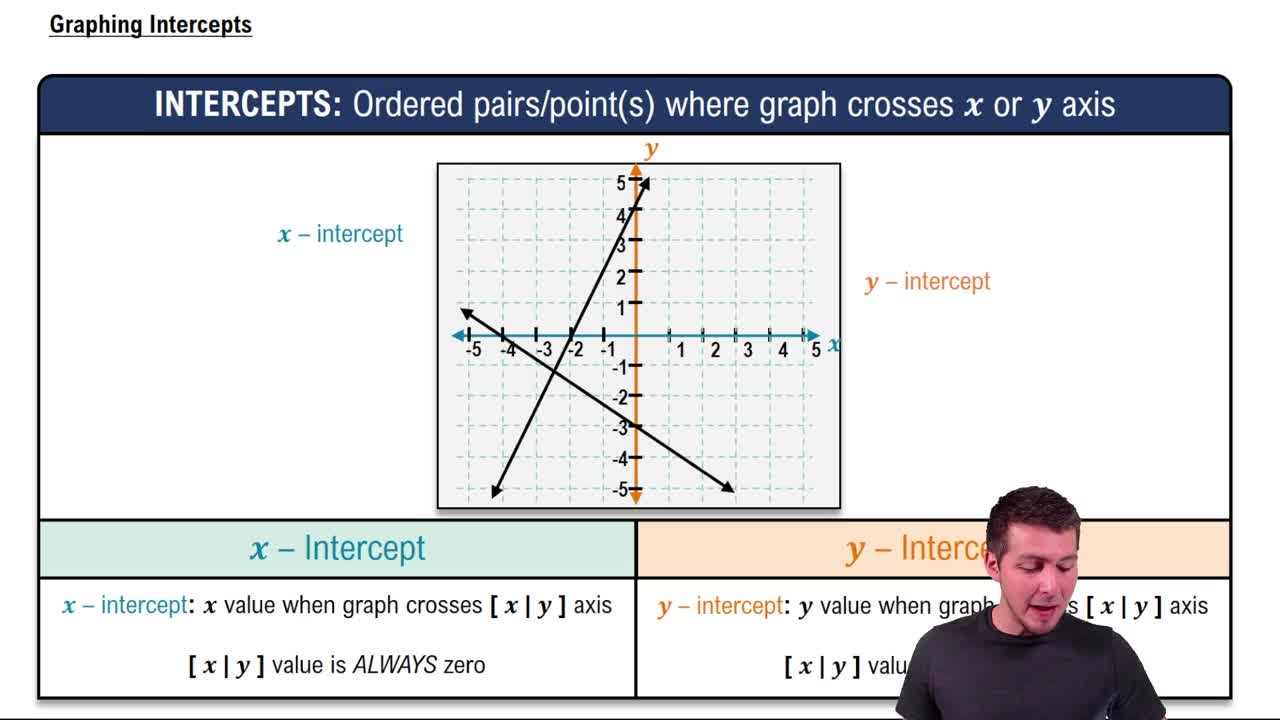
X-Intercepts
X-intercepts are the points where a graph crosses the x-axis, indicating where the function's output (y-value) is zero. To find x-intercepts, set the function equal to zero and solve for x. In the provided graph, the x-intercepts are located at the points (-8, 0) and (10, 0).
Video consigliato:
Graphing Intercepts
Y-Intercept
The y-intercept is the point where a graph intersects the y-axis, representing the value of the function when x is zero. To determine the y-intercept, evaluate the function at x = 0. In the graph, the y-intercept is at the point (0, 8), indicating that the function's value is 8 when x is zero.
Video consigliato:
Graphing Intercepts
Function Values
Function values refer to the outputs of a function for specific inputs. In the context of the graph, missing function values can be identified by observing the graph at given x-values. For instance, the graph shows a missing value at (0, -10), which indicates that the function's output is -10 when x is 0, highlighting the importance of analyzing the graph's behavior.
Video consigliato:
Function Composition
Pratica correlata
Domanda del libro di testo
1204
views
Domanda del libro di testo
Begin by graphing the square root function, f(x) = √x. Then use transformations of this graph to graph the given function. h(x) = √(x+1)-1
780
views
Domanda del libro di testo
Use the graph to determine a.the x-intercepts, if any; b. the y-intercept, if any; and e. the missing function values, indicated by question marks, below each graph.
962
views
Domanda del libro di testo
Use the graph to determine a.the x-intercepts, if any; b. the y-intercept, if any; and e. the missing function values, indicated by question marks, below each graph.
96
views
Domanda del libro di testo
Begin by graphing the square root function, f(x) = √x. Then use transformations of this graph to graph the given function. g(x) = 2√(x+1)
888
views
Domanda del libro di testo
Find the domain of each function. g(x) = 4/(x - 7)
1156
views