Ch. 2 - Functions and Graphs
Blitzer - College Algebra 8th Edition
Blitzer8th EditionCollege AlgebraISBN: 9780136970514Non è quello che usi tu?Cambia libro di testo
Capitolo 3, Problema 82

Graph each linear function. 6x-5f(x) - 20 = 0

Guida verificata passo dopo passo
1
Rewrite the given equation to isolate the function \( f(x) \). The original equation is \( 6x - 5f(x) - 20 = 0 \). Add \( 5f(x) \) and subtract \( 6x \) from both sides to get \( -5f(x) = -6x + 20 \).
Divide both sides of the equation by \( -5 \) to solve for \( f(x) \). This gives \( f(x) = \frac{-6x + 20}{-5} \).
Simplify the right-hand side by dividing each term separately: \( f(x) = \frac{-6x}{-5} + \frac{20}{-5} \), which simplifies to \( f(x) = \frac{6}{5}x - 4 \).
Identify the slope and y-intercept from the equation \( f(x) = \frac{6}{5}x - 4 \). The slope \( m = \frac{6}{5} \) and the y-intercept \( b = -4 \).
To graph the function, start by plotting the y-intercept at \( (0, -4) \). Then use the slope \( \frac{6}{5} \) to find another point by rising 6 units and running 5 units to the right. Draw a straight line through these points to complete the graph.

Risposta video verificata per un problema simile:

Questa soluzione video è stata consigliata dai nostri tutor come utile per risolvere questo problema.
Durata del video:
2m

Concetti chiave

Ecco i concetti essenziali che devi comprendere per rispondere correttamente alla domanda.

Linear Functions

A linear function is a function whose graph is a straight line, typically expressed in the form y = mx + b, where m is the slope and b is the y-intercept. Understanding linear functions helps in identifying how changes in x affect the output f(x).
Video consigliato:
06:07
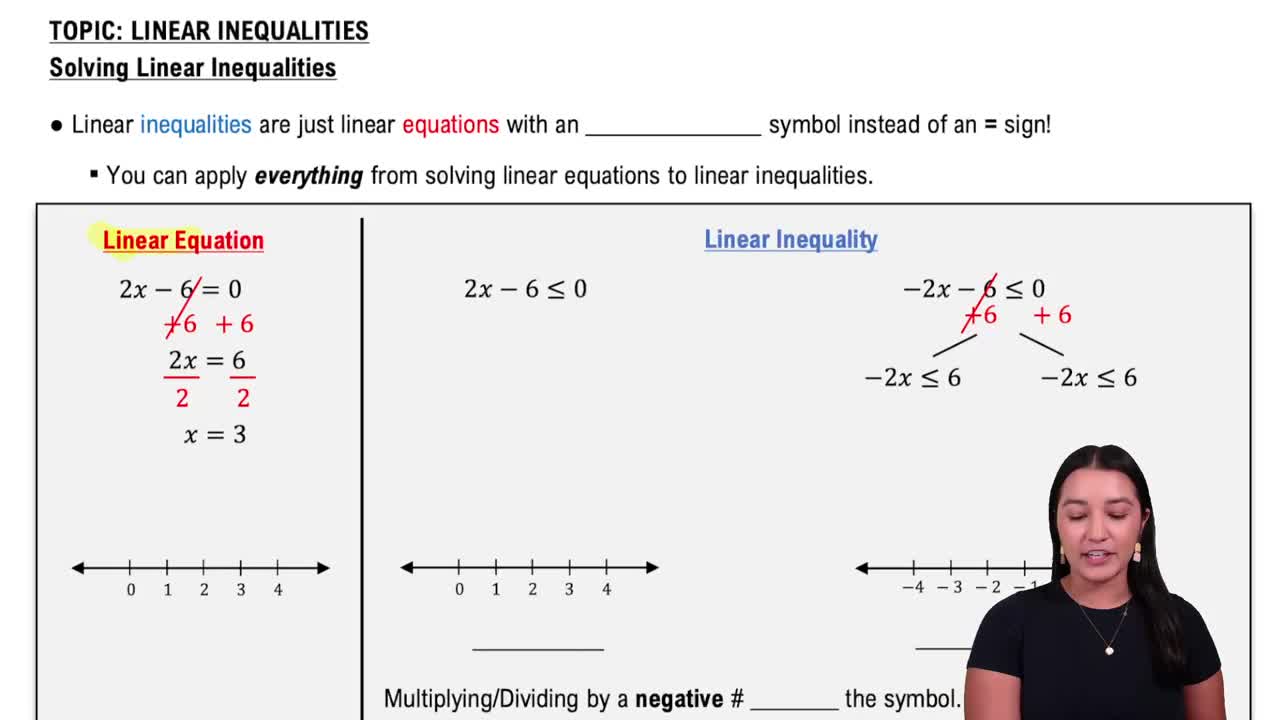
Linear Inequalities

Rearranging Equations

Rearranging equations involves manipulating the given equation to isolate the dependent variable, usually f(x) or y, on one side. This step is essential to rewrite the function in slope-intercept form, making it easier to graph.
Video consigliato:
06:00
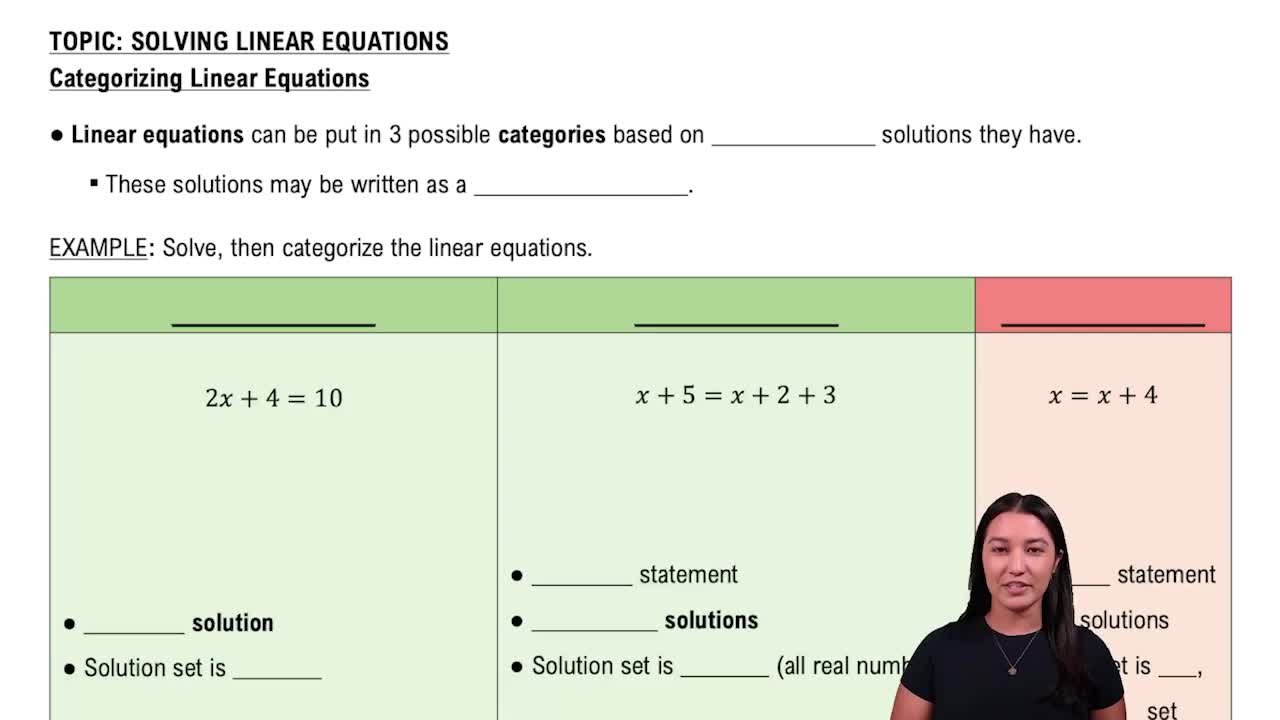
Categorizing Linear Equations

Graphing Linear Equations

Graphing linear equations requires plotting points or using the slope and y-intercept to draw the line on the coordinate plane. Recognizing the slope and intercept from the equation allows for accurate and efficient graphing.
Video consigliato:
06:00
Categorizing Linear Equations