Ch. 2 - Functions and Graphs
Blitzer - College Algebra 8th Edition
Blitzer8th EditionCollege AlgebraISBN: 9780136970514Non è quello che usi tu?Cambia libro di testo
Capitolo 3, Problema 72

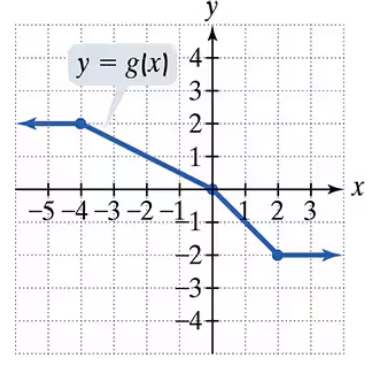
Use the graph of g to solve Exercises 71–76.

Find g(2)

Guida verificata passo dopo passo
1
Identify the function g on the graph, which is represented by the red line with points marked.
Locate the x-value of 2 on the horizontal axis (x-axis).
From x = 2, move vertically upwards or downwards until you reach the point on the graph of g.
Determine the y-coordinate of the point on the graph directly above or below x = 2. This y-coordinate is the value of g(2).
Write the value of g(2) as the y-coordinate found in the previous step.

Risposta video verificata per un problema simile:

Questa soluzione video è stata consigliata dai nostri tutor come utile per risolvere questo problema.
Durata del video:
1m

Concetti chiave

Ecco i concetti essenziali che devi comprendere per rispondere correttamente alla domanda.

Function Notation

Function notation, such as g(2), represents the output value of the function g when the input is 2. It is a way to denote the relationship between input values (domain) and output values (range) in a function.
Video consigliato:
05:18
Interval Notation

Reading a Graph of a Function

To find g(2) from a graph, locate the input value 2 on the x-axis, then find the corresponding point on the graph. The y-coordinate of this point is the value of g(2). This process helps visualize how the function behaves.
Video consigliato:
5:26
Graphs of Logarithmic Functions

Coordinate Plane and Points

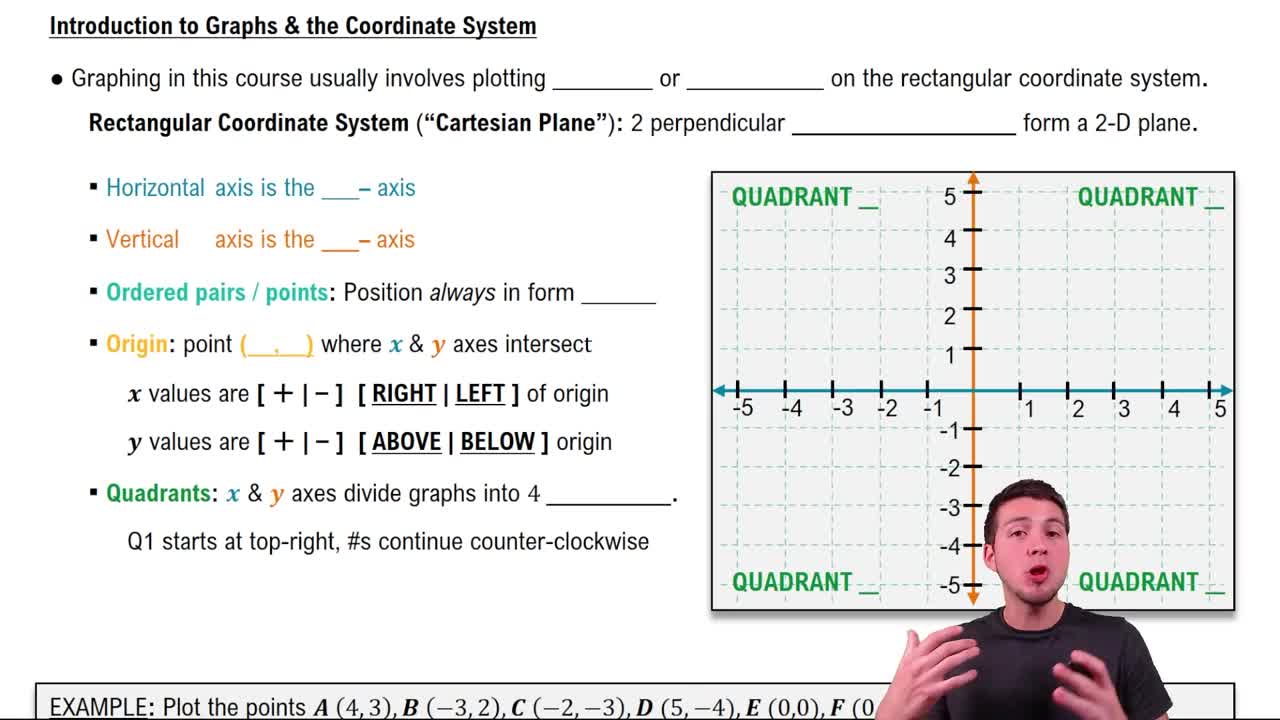
The coordinate plane consists of an x-axis (horizontal) and y-axis (vertical). Points on the graph are represented as (x, y), where x is the input and y is the output. Understanding how to interpret these points is essential for analyzing functions.
Video consigliato:
05:10
Graphs & the Rectangular Coordinate System