Ch. 5 - Systems of Equations and Inequalities
Blitzer - College Algebra 8th Edition
Blitzer8th EditionCollege AlgebraISBN: 9780136970514Non è quello che usi tu?Cambia libro di testo
Capitolo 6, Problema 13

Graph each inequality. x2+y2≤1

Guida verificata passo dopo passo
1
Recognize that the inequality \(x^{2} + y^{2} \leq 1\) represents all points \((x, y)\) whose distance from the origin is less than or equal to 1. This describes a circle centered at the origin with radius 1, including the interior.
Rewrite the inequality as \(x^{2} + y^{2} \leq 1\) to emphasize that the boundary is the circle \(x^{2} + y^{2} = 1\).
Graph the boundary circle by plotting points that satisfy \(x^{2} + y^{2} = 1\). For example, points \((1,0)\), \((-1,0)\), \((0,1)\), and \((0,-1)\) lie on the circle.
Since the inequality is \(\leq\) (less than or equal to), shade the entire region inside the circle, including the boundary, to represent all points where \(x^{2} + y^{2} \leq 1\).
Optionally, test a point inside the circle, such as \((0,0)\), by substituting into the inequality to confirm it satisfies \(x^{2} + y^{2} \leq 1\), ensuring the shading is correct.

Risposta video verificata per un problema simile:

Questa soluzione video è stata consigliata dai nostri tutor come utile per risolvere questo problema.
Durata del video:
5m

Concetti chiave

Ecco i concetti essenziali che devi comprendere per rispondere correttamente alla domanda.

Graphing Inequalities

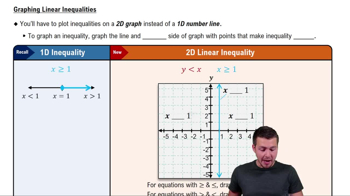
Graphing inequalities involves shading the region of the coordinate plane that satisfies the inequality. For example, for an inequality like x² + y² ≤ 1, you graph the boundary curve first, then shade the area where the inequality holds true, including points on the boundary if the inequality is ≤ or ≥.
Video consigliato:
7:02
Linear Inequalities

Equation of a Circle

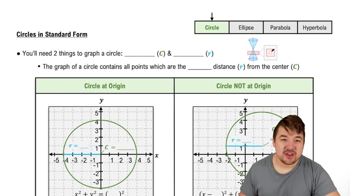
The equation x² + y² = 1 represents a circle centered at the origin (0,0) with radius 1. Understanding this helps in graphing the boundary of the inequality, as the circle defines the limit of the region to be shaded.
Video consigliato:
5:18
Circles in Standard Form

Closed vs. Open Regions

Inequalities with ≤ or ≥ include the boundary curve, meaning the region is closed and the boundary is part of the solution set. In contrast, < or > inequalities exclude the boundary, resulting in an open region. This distinction affects how the graph is drawn.
Video consigliato:
3:18
Permutations vs. Combinations