Ch. 12 - Regulation of Gene Expression in Bacteria and Bacteriophage
Sanders - Genetic Analysis: An Integrated Approach 3rd Edition
Sanders3rd EditionGenetic Analysis: An Integrated ApproachISBN: 9780135564172Non è quello che usi tu?Cambia libro di testo
Capitolo 12, Problema 37b

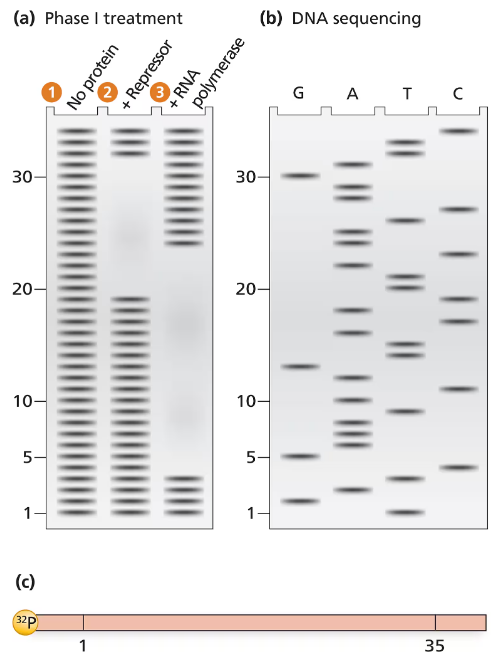
The electrophoresis gel shown in part (a) is from a DNase I footprint analysis of an operon transcription control region. DNA sequence analysis of a 35-bp region is shown in part (b). The control region, labeled with ³²P at one end, is shown in a map in part (c). Separate samples of control-region DNA are exposed to DNase I, and the resulting DNase I–digested DNA is run in separate lanes of the electrophoresis gel. Unprotected DNA is in lane 1, DNA protected by repressor protein is in lane 2, and RNA polymerase–protected DNA is in lane 3. The numbers along the electrophoresis gel correspond to the 35-bp sequence labeled on the map in part (c). Use the information provided to solve the following problems.
Electrophoresis gel showing DNA protected by repressor and RNA polymerase, with corresponding DNA sequence analysis.
Locate the regions of the sequence protected by repressor protein and by RNA polymerase.

Guida verificata passo dopo passo
1
Step 1: Understand the DNase I footprinting technique. DNase I footprinting is used to identify regions of DNA that are bound by proteins, as these regions are protected from DNase I digestion. The electrophoresis gel shows the DNA fragments generated after DNase I digestion, with gaps in the gel indicating protected regions where proteins are bound.
Step 2: Analyze lane 1 (unprotected DNA). This lane serves as a control and shows the pattern of DNA fragments when no protein is bound to the DNA. It provides a baseline for comparison with lanes 2 and 3.
Step 3: Examine lane 2 (DNA protected by repressor protein). Identify gaps or missing bands in the gel compared to lane 1. These gaps correspond to regions of the DNA sequence that are protected by the repressor protein, as DNase I cannot digest DNA bound by the protein.
Step 4: Examine lane 3 (DNA protected by RNA polymerase). Similarly, identify gaps or missing bands in the gel compared to lane 1. These gaps correspond to regions of the DNA sequence that are protected by RNA polymerase, indicating where the polymerase is bound to the DNA.
Step 5: Map the protected regions to the 35-bp sequence. Use the numbers along the gel and the sequence map provided in part (c) to locate the specific nucleotide positions that are protected by the repressor protein and RNA polymerase. This will allow you to determine the exact regions of the sequence involved in transcription regulation.

Risposta video verificata per un problema simile:

Questa soluzione video è stata consigliata dai nostri tutor come utile per risolvere questo problema.
Durata del video:
5m

Concetti chiave

Ecco i concetti essenziali che devi comprendere per rispondere correttamente alla domanda.

DNase I Footprint Analysis

DNase I footprint analysis is a technique used to identify the specific regions of DNA that are bound by proteins, such as transcription factors. When DNA is treated with DNase I, the enzyme cleaves unprotected regions, while bound proteins shield their respective DNA segments from digestion. The resulting fragments are then analyzed through electrophoresis, allowing researchers to visualize which parts of the DNA are protected by proteins, indicating their binding sites.
Video consigliato:
Percorso guidato
02:48
Chi Square Analysis

Electrophoresis

Electrophoresis is a laboratory method used to separate DNA, RNA, or proteins based on their size and charge. In this process, samples are placed in a gel matrix and subjected to an electric field, causing the molecules to migrate. Smaller fragments move faster and farther than larger ones, creating distinct bands that can be visualized. This technique is crucial for analyzing the results of DNase I footprinting, as it allows for the comparison of protected versus unprotected DNA segments.
Video consigliato:

Transcription Regulation

Transcription regulation refers to the mechanisms that control the transcription of genes, determining when and how much of a gene product is produced. Proteins such as repressors and activators bind to specific regions of DNA, influencing the recruitment of RNA polymerase, the enzyme responsible for synthesizing RNA from a DNA template. Understanding how these proteins interact with DNA is essential for interpreting the results of footprinting experiments, as it reveals the functional elements of gene control regions.
Video consigliato:
Percorso guidato
09:16
Eukaryotic Transcription
Pratica correlata
Domanda del libro di testo

For the following lac operon partial diploids, determine whether the synthesis of lacZ mRNA is 'constitutive,' 'inducible,' or 'uninducible,' and indicate whether the partial diploid is or (able or not able to utilize lactose). 

875
views
Domanda del libro di testo

The electrophoresis gel shown in part (a) is from a DNase I footprint analysis of an operon transcription control region. DNA sequence analysis of a 35-bp region is shown in part (b). The control region, labeled with ³²P at one end, is shown in a map in part (c). Separate samples of control-region DNA are exposed to DNase I, and the resulting DNase I–digested DNA is run in separate lanes of the electrophoresis gel. Unprotected DNA is in lane 1, DNA protected by repressor protein is in lane 2, and RNA polymerase–protected DNA is in lane 3. The numbers along the electrophoresis gel correspond to the 35-bp sequence labeled on the map in part (c). Use the information provided to solve the following problems.

Determine the DNA sequence of the 35-bp region examined.

475
views
Domanda del libro di testo

A bacterial inducible operon, similar to the lac operon, contains three genes—R, T, and S—that are involved in coordinated regulation of transcription. One of these genes is an operator region, one is a regulatory protein, and the third produces a structural enzyme. In the table below, '+' indicates that the structural enzyme is synthesized and '−' indicates that it is not produced. Use the information provided to determine which gene is the operator, which produces the regulatory protein, and which produces the enzyme.

705
views