Ch. 12 - Regulation of Gene Expression in Bacteria and Bacteriophage
Sanders - Genetic Analysis: An Integrated Approach 3rd Edition
Sanders3rd EditionGenetic Analysis: An Integrated ApproachISBN: 9780135564172Non è quello che usi tu?Cambia libro di testo
Capitolo 12, Problema 37a

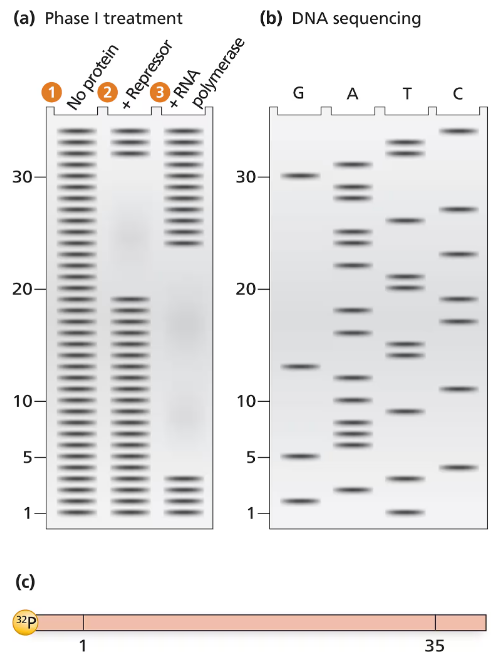
The electrophoresis gel shown in part (a) is from a DNase I footprint analysis of an operon transcription control region. DNA sequence analysis of a 35-bp region is shown in part (b). The control region, labeled with ³²P at one end, is shown in a map in part (c). Separate samples of control-region DNA are exposed to DNase I, and the resulting DNase I–digested DNA is run in separate lanes of the electrophoresis gel. Unprotected DNA is in lane 1, DNA protected by repressor protein is in lane 2, and RNA polymerase–protected DNA is in lane 3. The numbers along the electrophoresis gel correspond to the 35-bp sequence labeled on the map in part (c). Use the information provided to solve the following problems.
Electrophoresis gel showing DNase I footprint analysis with lanes for unprotected, repressor-protected, and RNA polymerase-protected DNA.
Determine the DNA sequence of the 35-bp region examined.

Guida verificata passo dopo passo
1
Step 1: Understand the DNase I footprinting technique. DNase I footprinting is used to identify regions of DNA that are bound by proteins, as these regions are protected from DNase I digestion. The electrophoresis gel shows the digested DNA fragments, with gaps indicating protected regions where proteins are bound.
Step 2: Analyze the electrophoresis gel lanes. Lane 1 represents unprotected DNA, showing a complete digestion pattern. Lane 2 represents DNA protected by the repressor protein, and lane 3 represents DNA protected by RNA polymerase. Compare the patterns in these lanes to identify protected regions.
Step 3: Correlate the gel bands with the DNA sequence map. The numbers along the gel correspond to the 35-bp sequence labeled on the map in part (c). Use the absence of bands in lanes 2 and 3 to determine which regions of the DNA sequence are protected by the repressor protein and RNA polymerase.
Step 4: Deduce the DNA sequence from the gel. The unprotected DNA in lane 1 provides the full digestion pattern, which can be used to infer the sequence. Combine this information with the protected regions identified in lanes 2 and 3 to reconstruct the 35-bp DNA sequence.
Step 5: Verify the sequence alignment. Ensure that the reconstructed DNA sequence matches the map provided in part (c) and aligns with the protection patterns observed in the gel. This confirms the accuracy of the sequence determination.

Risposta video verificata per un problema simile:

Questa soluzione video è stata consigliata dai nostri tutor come utile per risolvere questo problema.
Durata del video:
4m

Concetti chiave

Ecco i concetti essenziali che devi comprendere per rispondere correttamente alla domanda.

DNase I Footprint Analysis

DNase I footprint analysis is a technique used to study protein-DNA interactions. In this method, DNase I is used to digest DNA, but the presence of bound proteins protects certain regions from cleavage. The resulting fragments are then analyzed through electrophoresis, allowing researchers to identify which parts of the DNA were protected by proteins, indicating their binding sites.
Video consigliato:
Percorso guidato
02:48
Chi Square Analysis

Electrophoresis

Electrophoresis is a laboratory technique used to separate macromolecules, such as DNA, based on their size and charge. In this process, DNA samples are placed in a gel matrix and subjected to an electric field, causing the molecules to migrate. Smaller fragments move faster and farther than larger ones, allowing for the visualization of different DNA fragments after staining, which is crucial for analyzing the results of DNase I footprinting.
Video consigliato:

Operon and Transcription Regulation

An operon is a cluster of genes under the control of a single promoter, allowing for coordinated regulation of gene expression. In prokaryotes, transcription factors, such as repressors and activators, bind to specific regions of the operon to regulate transcription. Understanding how these proteins interact with the DNA control region is essential for interpreting the results of the DNase I footprint analysis, as it reveals which sequences are critical for transcription regulation.
Video consigliato:
Percorso guidato
06:55
Lac Operon Regulation
Pratica correlata
Domanda del libro di testo

The electrophoresis gel shown in part (a) is from a DNase I footprint analysis of an operon transcription control region. DNA sequence analysis of a 35-bp region is shown in part (b). The control region, labeled with ³²P at one end, is shown in a map in part (c). Separate samples of control-region DNA are exposed to DNase I, and the resulting DNase I–digested DNA is run in separate lanes of the electrophoresis gel. Unprotected DNA is in lane 1, DNA protected by repressor protein is in lane 2, and RNA polymerase–protected DNA is in lane 3. The numbers along the electrophoresis gel correspond to the 35-bp sequence labeled on the map in part (c). Use the information provided to solve the following problems.

Locate the regions of the sequence protected by repressor protein and by RNA polymerase.

441
views
Domanda del libro di testo

For the following lac operon partial diploids, determine whether the synthesis of lacZ mRNA is 'constitutive,' 'inducible,' or 'uninducible,' and indicate whether the partial diploid is or (able or not able to utilize lactose). 

875
views
Domanda del libro di testo

Northern blot analysis is performed on cellular mRNA isolated from E. coli. The probe used in the northern blot analysis hybridizes to a portion of the lacY sequence. Below is an example of the gel from northern blot analysis for a wild-type lac⁺ bacterial strain. In this gel, lane 1 is from bacteria grown in a medium containing only glucose (minimal medium). Lane 2 is from bacteria in a medium containing only lactose. Following the style of this diagram, draw the gel appearance for northern blots of the bacteria listed below. In each case, lane 1 is for mRNA isolated after growth in a glucose-containing (minimal) medium, and lane 2 is for mRNA isolated after growth in a lactose-only medium.

lac⁻ bacteria with the genotype I⁺ P⁺ O⁺ Z⁺ Y⁺ and a mutation that prevents CAP–cAMP binding to the CAP site 

690
views
Domanda del libro di testo

A bacterial inducible operon, similar to the lac operon, contains three genes—R, T, and S—that are involved in coordinated regulation of transcription. One of these genes is an operator region, one is a regulatory protein, and the third produces a structural enzyme. In the table below, '+' indicates that the structural enzyme is synthesized and '−' indicates that it is not produced. Use the information provided to determine which gene is the operator, which produces the regulatory protein, and which produces the enzyme.

705
views