Ch. 20 - Population Genetics and Evolution at the Population, Species, and Molecular Levels
Sanders - Genetic Analysis: An Integrated Approach 3rd Edition
Sanders3rd EditionGenetic Analysis: An Integrated ApproachISBN: 9780135564172Non è quello che usi tu?Cambia libro di testo
Capitolo 20, Problema 11

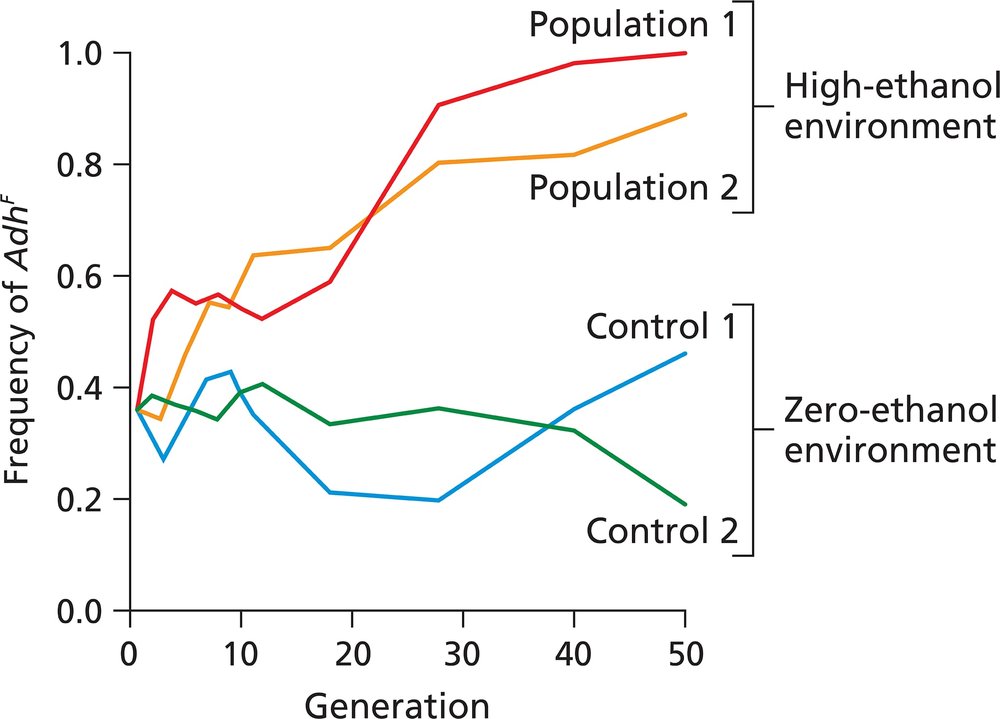
The figure illustrates the effect of an ethanol-rich and an ethanol-free environment on the frequency of the Drosophila AdhF allele in four populations in a 50-generation laboratory experiment. Population 1 and population 2 were reared for 50 generations in a high-ethanol environment, while control 1 and control 2 populations were reared for 50 generations in a zero-ethanol environment. Describe the effect of each environment on the populations, and state any conclusions you can reach about the role of any of the evolutionary processes in producing these effects.

Guida verificata passo dopo passo
1
Step 1: Observe the initial frequency of the Adh^F allele in all four populations at generation 0, noting that they start at similar frequencies around 0.35 to 0.4.
Step 2: Compare the changes in allele frequency over 50 generations between populations reared in the high-ethanol environment (Population 1 and Population 2) and those in the zero-ethanol environment (Control 1 and Control 2). Notice that in the high-ethanol environment, the frequency of Adh^F increases significantly, approaching fixation in Population 1 and rising substantially in Population 2.
Step 3: Examine the zero-ethanol environment controls, where the frequency of Adh^F either decreases or fluctuates without a clear directional trend, indicating no strong selection for the allele in this environment.
Step 4: Conclude that the high-ethanol environment exerts positive selection pressure favoring the Adh^F allele, likely because this allele confers a fitness advantage in metabolizing ethanol, while in the zero-ethanol environment, there is no such advantage, and genetic drift or other evolutionary forces may influence allele frequency.
Step 5: Recognize that natural selection is the primary evolutionary process driving the increase in Adh^F frequency in the ethanol-rich environment, whereas in the ethanol-free environment, genetic drift or neutral evolution may be responsible for the observed allele frequency changes.

Risposta video verificata per un problema simile:

Questa soluzione video è stata consigliata dai nostri tutor come utile per risolvere questo problema.
Durata del video:
1m

Concetti chiave

Ecco i concetti essenziali che devi comprendere per rispondere correttamente alla domanda.

Natural Selection

Natural selection is the process where individuals with advantageous traits have higher survival and reproduction rates, leading to an increase in those traits in the population. In this experiment, the increase in AdhF allele frequency in high-ethanol environments suggests that this allele confers a selective advantage under ethanol stress.
Video consigliato:
Percorso guidato
05:54
Natural Selection

Allele Frequency and Genetic Variation

Allele frequency refers to how common a particular allele is in a population. Changes in allele frequency over generations indicate evolutionary processes at work. The graph shows how the AdhF allele frequency changes differently in ethanol-rich versus ethanol-free environments, highlighting the role of environmental factors in shaping genetic variation.
Video consigliato:
Percorso guidato
03:03
New Alleles and Migration

Role of Environmental Pressure in Evolution

Environmental pressures, such as the presence or absence of ethanol, can influence which alleles are favored by natural selection. The experiment demonstrates that ethanol acts as a selective pressure, increasing the frequency of the AdhF allele in populations exposed to it, while in ethanol-free environments, allele frequencies fluctuate without a clear directional trend.
Video consigliato:
Pratica correlata
Domanda del libro di testo
Biologists have proposed that the use of antibiotics to treat human infectious disease has played a role in the evolution of widespread antibiotic resistance in several bacterial species, including Staphylococcus aureus and the bacteria causing gonorrhea, tuberculosis, and other infectious diseases. Explain how the evolutionary mechanisms mutation and natural selection may have contributed to the development of antibiotic resistance.
487
views
Domanda del libro di testo

In Island Melanesia and Polynesia, most mtDNA haplotypes are of Asian ancestry, whereas Y chromosome haplotypes are predominantly New Guinean. Provide a hypothesis for this sex-biased distribution.

449
views
Domanda del libro di testo

The ability to taste the bitter compound phenylthiocarbamide (PTC) is an autosomal dominant trait. The inability to taste PTC is a recessive condition. In a sample of 500 people, 360 have the ability to taste PTC and 140 do not. Calculate the frequency of each genotype.

1237
views
Domanda del libro di testo

The ability to taste the bitter compound phenylthiocarbamide (PTC) is an autosomal dominant trait. The inability to taste PTC is a recessive condition. In a sample of 500 people, 360 have the ability to taste PTC and 140 do not. Calculate the frequency of the recessive allele.

563
views
Domanda del libro di testo

A 9-bp deletion in the mitochondrial genome between the gene for cytochrome oxidase subunit II and the gene for tRNAᴸʸˢ is a common polymorphism among Polynesians and also in a population of Taiwanese natives. The frequency of the polymorphism varies between populations: The highest frequency is seen in the Maoris of New Zealand (98%), lower levels are seen in eastern Polynesia (80%) and western Polynesia (89%), and the lowest level is seen in the Taiwanese population. What do these frequencies tell us about the settlement of the Pacific by the ancestors of the present-day Polynesians?

437
views
Domanda del libro di testo

The ability to taste the bitter compound phenylthiocarbamide (PTC) is an autosomal dominant trait. The inability to taste PTC is a recessive condition. In a sample of 500 people, 360 have the ability to taste PTC and 140 do not. Calculate the frequency of the dominant allele.

465
views