Ch. 5 - Chemical Reaction Analysis: Thermodynamics and Kinetics
Mullins - Organic Chemistry: A Learner Centered Approach 1st Edition
Mullins1st EditionOrganic Chemistry: A Learner Centered ApproachISBN: 9780137566471Non è quello che usi tu?Cambia libro di testo
Capitolo 4, Problema 20b

Draw a reaction coordinate diagram for a one step reaction that has the following values of Ea and ∆H. (b) Ea = 2 kcal/mol ; ∆H° = -17 kcal/mol

Guida verificata passo dopo passo
1
Understand the key terms: Eₐ (activation energy) is the energy barrier that must be overcome for the reaction to proceed, and ∆H° (enthalpy change) is the difference in energy between the reactants and products. A negative ∆H° indicates an exothermic reaction, where the products are lower in energy than the reactants.
Start by drawing the x-axis (reaction progress) and y-axis (energy) for the reaction coordinate diagram. Label the axes appropriately.
Plot the energy of the reactants as a starting point on the y-axis. Since the reaction is exothermic (∆H° = -17 kcal/mol), the energy of the products will be lower than that of the reactants by 17 kcal/mol.
Add the activation energy (Eₐ = 2 kcal/mol) as a peak above the reactants' energy level. The height of this peak relative to the reactants' energy represents the activation energy barrier.
Draw a smooth curve starting from the reactants' energy level, rising to the peak (activation energy), and then descending to the products' energy level, which is 17 kcal/mol lower than the reactants. Label the peak as the transition state and indicate the values of Eₐ and ∆H° on the diagram.

Risposta video verificata per un problema simile:

Questa soluzione video è stata consigliata dai nostri tutor come utile per risolvere questo problema.

Concetti chiave

Ecco i concetti essenziali che devi comprendere per rispondere correttamente alla domanda.

Reaction Coordinate Diagram

A reaction coordinate diagram is a graphical representation that illustrates the energy changes during a chemical reaction. The x-axis typically represents the progress of the reaction, while the y-axis shows the energy of the system. It highlights the transition state, the energy of reactants and products, and the activation energy (Eₐ), providing insight into the reaction mechanism and thermodynamics.
Video consigliato:
05:02
Coordination Complexes

Activation Energy (Eₐ)

Activation energy (Eₐ) is the minimum energy required for a reaction to occur. It represents the energy barrier that must be overcome for reactants to transform into products. In the context of the given values, a low Eₐ of 2 kcal/mol indicates that the reaction can proceed relatively easily, suggesting a fast reaction rate under appropriate conditions.
Video consigliato:
08:30
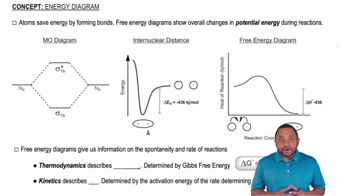
Introduction to free energy diagrams.

Enthalpy Change (∆H°)

Enthalpy change (∆H°) refers to the difference in energy between the reactants and products of a reaction. A negative ∆H° value, such as -17 kcal/mol, indicates that the reaction is exothermic, meaning it releases energy to the surroundings. This information is crucial for understanding the thermodynamic favorability of the reaction and its potential to occur spontaneously.
Video consigliato:
04:38
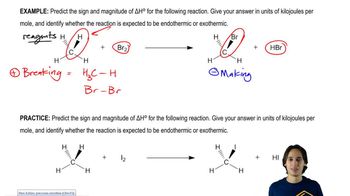
Calculating Enthalpies