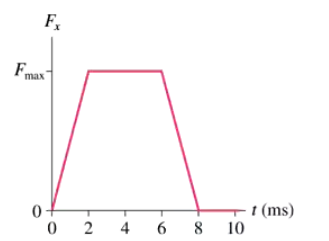
A 2.0 kg object is moving to the right with a speed of when it experiences the force shown in FIGURE EX11.9. What are the object's speed and direction after the force ends?
Ch 11: Impulse and Momentum
Knight Calc5th EditionPhysics for Scientists and EngineersISBN: 9780137344796Non è quello che usi tu?Cambia libro di testo
Capitolo 11, Problema 5
In FIGURE EX11.5, what value of Fmax gives an impulse of 6.0 N s?

Guida verificata passo dopo passo1
Step 1: Recall the formula for impulse, which is given by \( J = F \cdot \Delta t \), where \( J \) is the impulse, \( F \) is the force, and \( \Delta t \) is the time interval during which the force acts.
Step 2: From the graph, observe that the force \( F_{\text{max}} \) acts over a time interval \( \Delta t \) from \( t = 4 \, \text{s} \) to \( t = 10 \, \text{s} \). Calculate \( \Delta t \) as \( \Delta t = 10 - 4 = 6 \, \text{s} \).
Step 3: Substitute the given impulse \( J = 6.0 \, \text{N} \cdot \text{s} \) and the time interval \( \Delta t = 6 \, \text{s} \) into the formula \( J = F \cdot \Delta t \). Rearrange the formula to solve for \( F \): \( F = \frac{J}{\Delta t} \).
Step 4: Perform the substitution: \( F = \frac{6.0}{6} \). This will give the value of \( F_{\text{max}} \).
Step 5: Interpret the result: The calculated \( F_{\text{max}} \) represents the maximum constant force that acts over the time interval \( \Delta t \) to produce the given impulse.

Risposta video verificata per un problema simile:
Questa soluzione video è stata consigliata dai nostri tutor come utile per risolvere questo problema.
Durata del video:
5mConcetti chiave
Ecco i concetti essenziali che devi comprendere per rispondere correttamente alla domanda.
Impulse
Impulse is defined as the change in momentum of an object when a force is applied over a period of time. It is mathematically represented as the product of force and the time duration for which the force acts. In this context, the impulse is given as 6.0 N·s, indicating the total effect of the force applied over the specified time interval.
Video consigliato:
Percorso guidato
Impulse & Impulse-Momentum Theorem
Force-Time Graph
A force-time graph visually represents how force varies with time. The area under the curve of this graph corresponds to the impulse experienced by an object. In the provided graph, the force is constant at Fmax for a certain duration, allowing for straightforward calculation of impulse by multiplying Fmax by the time interval during which the force is applied.
Video consigliato:
Percorso guidato
Velocity-Time Graphs & Acceleration
Calculating Fmax
To find the maximum force (Fmax) that results in a specific impulse, one can use the relationship between impulse, force, and time. Given the impulse (6.0 N·s) and the duration of the force application (which can be inferred from the graph), Fmax can be calculated using the formula: Impulse = Fmax × time. This allows for determining the required force to achieve the desired impulse.
Video consigliato:
Percorso guidato
Calculating Dot Product Using Vector Components
Pratica correlata
Domanda del libro di testo
2252
views
Domanda del libro di testo
FIGURE EX11.6 is an incomplete momentum bar chart for a collision that lasts 10 ms. What are the magnitude and direction of the average collision force exerted on the object?
2046
views
Domanda del libro di testo
What are the velocities of a 75 kg skydiver falling with ?
1701
views
Domanda del libro di testo
What is the impulse on a 3.0 kg particle that experiences the force shown in FIGURE EX11.4?
2454
views
1
comments
Domanda del libro di testo
What impulse does the force shown in FIGURE EX11.3 exert on a 250 g particle?
2139
views
Domanda del libro di testo
A 2.0 kg object is moving to the right with a speed of 1.0 m/s when it experiences the force shown in FIGURE EX11.8. What are the object's speed and direction after the force ends?
2227
views