Use the phase diagram of neon to answer the following questions. (a) What is the approximate value of the normal boiling point?
Ch.11 - Liquids and Intermolecular Forces
11장, 문제 61a
The phase diagram for neon is
Use the phase diagram to answer the following questions. (a) What is the approximate value of the normal melting point?
검증된 단계별 안내1
Step 1: Understand what a phase diagram is. A phase diagram is a graphical representation of the physical states of a substance under different temperatures and pressures. It shows the regions where the substance exists as a solid, liquid, or gas.
Step 2: Identify the 'normal melting point' on the phase diagram. The normal melting point is the temperature at which a substance changes from solid to liquid at 1 atmosphere of pressure. On a phase diagram, this is the point where the solid and liquid phases meet along the line that represents 1 atmosphere of pressure.
Step 3: Look at the phase diagram for neon. Find the point where the solid and liquid phases meet along the line that represents 1 atmosphere of pressure.
Step 4: Read off the temperature at this point. This is the normal melting point of neon.
Step 5: Remember that the exact value will depend on the specific phase diagram you are using. Make sure to use the scale provided on the diagram to get an accurate reading.

비슷한 문제에 대한 검증된 영상 답변:
이 영상 해법은 위 문제에 도움이 된다고 튜터들이 추천한 것입니다.
영상 길이:
1m도움이 되었나요?
주요 개념
질문에 올바르게 답하기 위해 반드시 이해해야 하는 핵심 개념들은 다음과 같습니다.
Phase Diagram
A phase diagram is a graphical representation that shows the phases of a substance (solid, liquid, gas) at various temperatures and pressures. It helps in understanding the conditions under which a substance will exist in different states. The lines on the diagram indicate phase transitions, such as melting and boiling points, and the areas represent the stable phases.
추천 영상:
가이드 코스
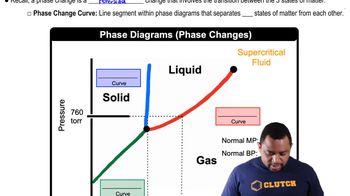
Phase Changes in Diagrams
Normal Melting Point
The normal melting point of a substance is the temperature at which it transitions from solid to liquid at a pressure of 1 atmosphere (atm). This value is crucial for identifying the thermal properties of materials and is typically found at the intersection of the solid and liquid phases on a phase diagram. For neon, this point indicates the temperature at which it can melt under standard atmospheric conditions.
추천 영상:
가이드 코스
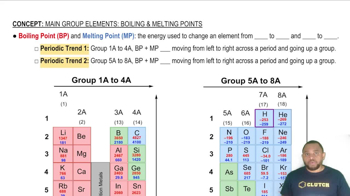
Boiling Point and Melting Point
Critical Point
The critical point on a phase diagram marks the end of the liquid-gas phase boundary, beyond which the liquid and gas phases become indistinguishable. Understanding the critical point is essential for comprehending the behavior of substances under extreme conditions. It provides insight into the limits of phase stability and is important for applications in fields like material science and thermodynamics.
추천 영상:
가이드 코스
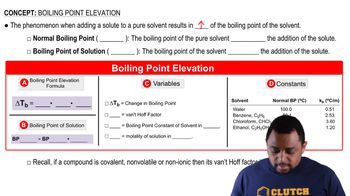
Boiling Point Elevation
관련 실천
교과서 질문
1
views
교과서 질문
Referring to Figure 11.29, describe the phase changes (and the temperatures at which they occur) when CO2 is heated from -80 to -20°C at (a) a constant pressure of 3 atm,
1224
views
교과서 질문
(b) Could you measure the triple point of water by measuring the temperature in a vessel in which water vapor, liquid water, and ice are in equilibrium under 1 atm of air? Explain.
690
views
교과서 질문
Use the phase diagram of neon to answer the following questions. (b) What can you say about the strength of the intermolecular forces in neon and argon based on the critical points of Ne and Ar (see Table 11.5.)?
687
views
교과서 질문
At 25 °C gallium is a solid with a density of 5.91 g/cm3. Its melting point, 29.8 °C, is low enough that you can melt it by holding it in your hand. The density of liquid gallium just above the melting point is 6.1 g/cm3. Based on this information, what unusual feature would you expect to find in the phase diagram of gallium?
1214
views