Ch.14 - Chemical Kinetics
Brown - Chemistry: The Central Science 14th Edition
Brown14th EditionChemistry: The Central ScienceISBN: 9780134414232당신이 사용하는 게 아니라요?교과서 변경
14장, 문제 10a

The accompanying graph shows plots of ln k versus 1>T for two different reactions. The plots have been extrapolated to the y-intercepts. Which reaction (red or blue) has (a) the larger value for Ea,
Graph showing ln k vs 1/T for two reactions, indicating their activation energies.

검증된 단계별 안내
1
Identify the Arrhenius equation in its linear form: \( \ln k = -\frac{E_a}{R} \cdot \frac{1}{T} + \ln A \).
Recognize that the slope of the line in the plot of \( \ln k \) versus \( \frac{1}{T} \) is equal to \( -\frac{E_a}{R} \).
Compare the slopes of the two lines (Reaction 1 and Reaction 2) on the graph. The steeper the slope, the larger the magnitude of \( -\frac{E_a}{R} \), and thus the larger the activation energy \( E_a \).
Observe that Reaction 2 has a steeper slope compared to Reaction 1.
Conclude that Reaction 2 has the larger activation energy \( E_a \) compared to Reaction 1.

비슷한 문제에 대한 검증된 영상 답변:

이 영상 해법은 위 문제에 도움이 된다고 튜터들이 추천한 것입니다.
영상 길이:
2m
도움이 되었나요?

주요 개념

질문에 올바르게 답하기 위해 반드시 이해해야 하는 핵심 개념들은 다음과 같습니다.

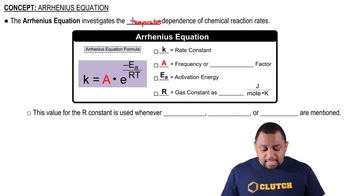
Arrhenius Equation

The Arrhenius equation describes the temperature dependence of reaction rates, expressed as k = A * e^(-Ea/RT), where k is the rate constant, A is the pre-exponential factor, Ea is the activation energy, R is the gas constant, and T is the temperature in Kelvin. This equation shows that as temperature increases, the rate constant k increases, indicating a faster reaction.
추천 영상:
가이드 코스
01:20
Arrhenius Equation

Activation Energy (Ea)

Activation energy (Ea) is the minimum energy required for a chemical reaction to occur. It represents the energy barrier that reactants must overcome to form products. In the context of the Arrhenius equation, a higher Ea results in a steeper slope in the ln k vs. 1/T plot, indicating that the reaction is less sensitive to temperature changes.
추천 영상:
가이드 코스
02:02
Activity Series Chart

Slope of the ln k vs. 1/T Plot

In a plot of ln k versus 1/T, the slope is equal to -Ea/R, where R is the gas constant. A steeper slope indicates a larger activation energy, meaning that the reaction requires more energy to proceed. By comparing the slopes of the two reactions in the graph, one can determine which reaction has a higher activation energy.
추천 영상:
가이드 코스
02:29
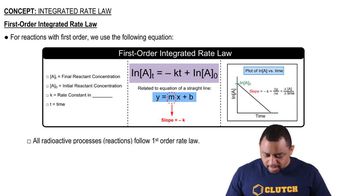
First-Order Reactions