
Ch.14 - Chemical Kinetics
Brown - Chemistry: The Central Science 14th Edition
Brown14th EditionChemistry: The Central ScienceISBN: 9780134414232당신이 사용하는 게 아니라요?교과서 변경
14장, 문제 10b

The accompanying graph shows plots of ln k versus 1>T for two different reactions. The plots have been extrapolated to the y-intercepts. Which reaction (red or blue) has (b) the larger value for the frequency factor, A? [Section 14.5]
Graph showing ln k vs 1/T for two reactions, indicating their frequency factors.

검증된 단계별 안내
1
Identify the Arrhenius equation in its linear form: \( \ln k = \ln A - \frac{E_a}{R} \cdot \frac{1}{T} \).
Recognize that the y-intercept of the plot of \( \ln k \) versus \( \frac{1}{T} \) corresponds to \( \ln A \).
Observe the graph and note the y-intercepts for both Reaction 1 (blue) and Reaction 2 (red).
Determine which reaction has the higher y-intercept value, as this indicates a larger \( \ln A \) value.
Conclude that the reaction with the higher y-intercept has the larger frequency factor, \( A \).

비슷한 문제에 대한 검증된 영상 답변:

이 영상 해법은 위 문제에 도움이 된다고 튜터들이 추천한 것입니다.
영상 길이:
1m
도움이 되었나요?

주요 개념

질문에 올바르게 답하기 위해 반드시 이해해야 하는 핵심 개념들은 다음과 같습니다.

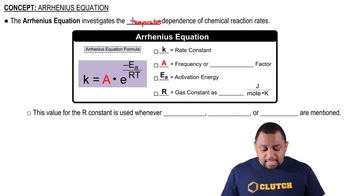
Arrhenius Equation

The Arrhenius equation relates the rate constant (k) of a reaction to temperature (T) and the frequency factor (A). It is expressed as k = A * e^(-Ea/RT), where Ea is the activation energy and R is the gas constant. The frequency factor A represents the number of collisions that result in a reaction, and it is influenced by factors such as molecular orientation and collision frequency.
추천 영상:
가이드 코스
01:20
Arrhenius Equation

Graphical Interpretation of ln k vs. 1/T

In a plot of ln k versus 1/T, the slope of the line is equal to -Ea/R, where Ea is the activation energy. The y-intercept of this plot corresponds to ln A, allowing for the determination of the frequency factor A. A higher y-intercept indicates a larger frequency factor, suggesting that the reaction has a greater likelihood of occurring due to more effective collisions.
추천 영상:
가이드 코스
02:33
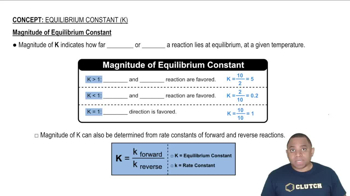
Magnitude of Equilibrium Constant

Extrapolation of Graphs

Extrapolation involves extending the plotted lines of the graph to find values outside the measured data range. In this context, extrapolating the lines to the y-intercept allows for the determination of the frequency factors for both reactions. By comparing the y-intercepts of the two reactions, one can ascertain which reaction has the larger frequency factor, A.
추천 영상:
가이드 코스
02:01
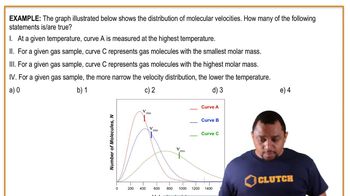
Velocity Distributions Example