Ch. 19 - Genetic Analysis of Quantitative Traits
Sanders - Genetic Analysis: An Integrated Approach 3rd Edition
Sanders3rd EditionGenetic Analysis: An Integrated ApproachISBN: 9780135564172당신이 사용하는 게 아니라요?교과서 변경
19장, 문제 17b

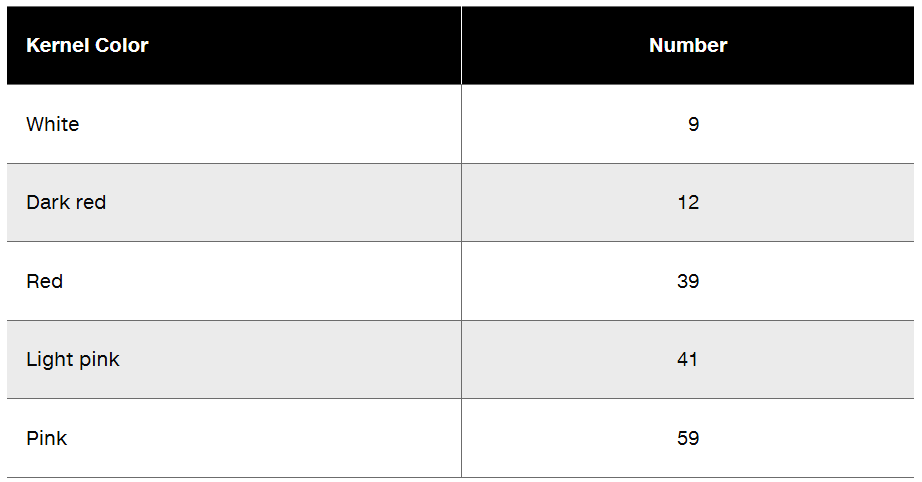
Two pure-breeding wheat strains, one producing dark red kernels and the other producing white kernels, are crossed to produce F₁ with pink kernel color. When an F₁ plant is self-fertilized and its seed collected and planted, the resulting F₂ consists of 160 plants with kernel colors as shown in the following table.
Table showing the number of wheat plants with different kernel colors: white, dark red, red, light pink, and pink.
How many additive alleles are required to explain the five phenotypes seen in the F₂?

검증된 단계별 안내
1
Step 1: Understand the concept of additive alleles. Additive alleles are genes that contribute incrementally to a trait, such as kernel color in wheat. Each allele adds a specific amount to the phenotype, resulting in a range of observable traits.
Step 2: Analyze the phenotypes and their distribution in the F₂ generation. The five phenotypes (White, Dark red, Red, Light pink, Pink) suggest a quantitative trait influenced by multiple alleles.
Step 3: Use the formula for the number of phenotypic classes in a quantitative trait: \( \text{Number of phenotypes} = \text{Number of additive alleles} + 1 \). Here, there are 5 phenotypes.
Step 4: Rearrange the formula to solve for the number of additive alleles: \( \text{Number of additive alleles} = \text{Number of phenotypes} - 1 \). Substitute the number of phenotypes (5) into the formula.
Step 5: Conclude that the number of additive alleles required to explain the five phenotypes is \( 5 - 1 \). This calculation provides the answer to the problem.

비슷한 문제에 대한 검증된 영상 답변:

이 영상 해법은 위 문제에 도움이 된다고 튜터들이 추천한 것입니다.
영상 길이:
3m
도움이 되었나요?

주요 개념

질문에 올바르게 답하기 위해 반드시 이해해야 하는 핵심 개념들은 다음과 같습니다.

Additive Alleles

Additive alleles are multiple alleles that contribute to a single trait in a cumulative manner. In the context of kernel color in wheat, each allele can influence the intensity or shade of the color produced. The presence of different combinations of these alleles results in a range of phenotypes, such as the various shades of red and pink observed in the F₂ generation.
추천 영상:
가이드 코스
03:03
New Alleles and Migration

Phenotypic Ratio

The phenotypic ratio is the relative frequency of different phenotypes in a population resulting from genetic crosses. In this case, the observed kernel colors in the F₂ generation can be analyzed to determine the ratio of each phenotype, which helps in understanding the underlying genetic mechanisms. The ratio can indicate the number of alleles involved and their interactions.
추천 영상:
가이드 코스
10:48
Mutations and Phenotypes

Incomplete Dominance

Incomplete dominance is a genetic scenario where the phenotype of heterozygotes is intermediate between the phenotypes of the two homozygotes. In this wheat example, the crossing of dark red and white strains resulting in pink kernels suggests that neither allele is completely dominant over the other. This concept is crucial for explaining the variety of kernel colors observed in the F₂ generation.
추천 영상:
가이드 코스
04:37
Variations on Dominance
관련 실천
교과서 질문

Two pure-breeding wheat strains, one producing dark red kernels and the other producing white kernels, are crossed to produce F₁ with pink kernel color. When an F₁ plant is self-fertilized and its seed collected and planted, the resulting F₂ consists of 160 plants with kernel colors as shown in the following table.

Using clearly defined allele symbols of your choice, give genotypes for the parental strains and the F₁. Describe the genotypes that produce the different phenotypes in the F₂.

470
views
교과서 질문

In a line of cherry tomatoes, the average fruit weight is 16 g. A plant producing tomatoes with an average weight of 12 g is used in one self-fertilization cross to produce a line of smaller tomatoes, and a plant producing tomatoes of 24 g is used in a second cross to produce larger tomatoes. If narrow sense heritability (h²) for this trait is 0.80, what are the expected responses to selection (R) for fruit weight in the crosses?

434
views
교과서 질문

In a line of cherry tomatoes, the average fruit weight is 16 g. A plant producing tomatoes with an average weight of 12 g is used in one self-fertilization cross to produce a line of smaller tomatoes, and a plant producing tomatoes of 24 g is used in a second cross to produce larger tomatoes. What is the selection differential (S) for fruit weight in each cross?

438
views
교과서 질문

Two pure-breeding wheat strains, one producing dark red kernels and the other producing white kernels, are crossed to produce F₁ with pink kernel color. When an F₁ plant is self-fertilized and its seed collected and planted, the resulting F₂ consists of 160 plants with kernel colors as shown in the following table.

Based on the F₂ progeny, how many genes are involved in kernel color determination?

464
views
교과서 질문

In studies of human MZ and DZ twin pairs of the same sex who are reared together, the following concordance values are identified for various traits. Based on the values shown, describe the relative importance of genes versus the influence of environmental factors for each trait.

484
views
교과서 질문

Two pure-breeding wheat strains, one producing dark red kernels and the other producing white kernels, are crossed to produce F₁ with pink kernel color. When an F₁ plant is self-fertilized and its seed collected and planted, the resulting F₂ consists of 160 plants with kernel colors as shown in the following table.

If an F₁ plant is crossed to a dark red plant, what are the expected progeny phenotypes, and what is the expected proportion of each phenotype?

437
views