Ch. 19 - Genetic Analysis of Quantitative Traits
Sanders - Genetic Analysis: An Integrated Approach 3rd Edition
Sanders3rd EditionGenetic Analysis: An Integrated ApproachISBN: 9780135564172당신이 사용하는 게 아니라요?교과서 변경
19장, 문제 17c

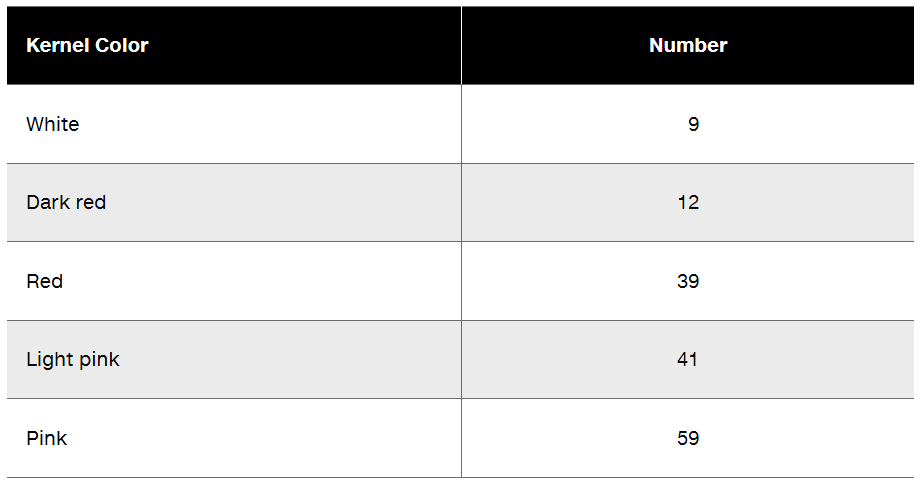
Two pure-breeding wheat strains, one producing dark red kernels and the other producing white kernels, are crossed to produce F₁ with pink kernel color. When an F₁ plant is self-fertilized and its seed collected and planted, the resulting F₂ consists of 160 plants with kernel colors as shown in the following table.
Table displaying the number of wheat plants with various kernel colors: white, dark red, red, light pink, and pink.
Using clearly defined allele symbols of your choice, give genotypes for the parental strains and the F₁. Describe the genotypes that produce the different phenotypes in the F₂.

검증된 단계별 안내
1
Step 1: Define allele symbols to represent the genetic basis of kernel color. For example, use 'A' and 'a' for one gene, and 'B' and 'b' for another gene. Assume that kernel color is determined by two genes, each with two alleles, where dominant alleles contribute to darker colors.
Step 2: Assign genotypes to the parental strains. The dark red strain could be homozygous dominant for both genes (AABB), while the white strain could be homozygous recessive for both genes (aabb). This ensures pure-breeding parental strains.
Step 3: Determine the genotype of the F₁ generation. Crossing AABB (dark red) with aabb (white) produces heterozygous offspring (AaBb), which exhibit the intermediate phenotype of pink kernel color due to incomplete dominance or additive effects.
Step 4: Describe the genotypes that produce the different phenotypes in the F₂ generation. When F₁ plants (AaBb) are self-fertilized, the offspring exhibit a variety of genotypes due to independent assortment and segregation. For example: AABB (dark red), AaBB or AABb (red), AaBb or Aabb or aaBb (pink/light pink), and aabb (white).
Step 5: Explain how the phenotypic ratios in the F₂ generation correspond to the genotypes. Use a Punnett square to predict the distribution of genotypes and phenotypes. The observed kernel color numbers (e.g., 9 white, 12 dark red, etc.) can be compared to the expected ratios based on Mendelian inheritance and additive effects of the alleles.

비슷한 문제에 대한 검증된 영상 답변:

이 영상 해법은 위 문제에 도움이 된다고 튜터들이 추천한 것입니다.
영상 길이:
3m
도움이 되었나요?

주요 개념

질문에 올바르게 답하기 위해 반드시 이해해야 하는 핵심 개념들은 다음과 같습니다.

Mendelian Genetics

Mendelian genetics is the study of how traits are inherited through generations, based on the principles established by Gregor Mendel. It involves understanding dominant and recessive alleles, where dominant alleles mask the expression of recessive ones. This framework helps explain the inheritance patterns observed in the F₁ and F₂ generations of the wheat strains, particularly in determining the phenotypic ratios.
추천 영상:
가이드 코스
03:45
Descriptive Genetics

Alleles and Genotypes

Alleles are different versions of a gene that can exist at a specific locus on a chromosome. In this scenario, the dark red and white kernel colors are determined by specific alleles, which can be represented by symbols (e.g., R for red and r for white). The genotype of an organism is the combination of alleles it possesses, which directly influences its phenotype, or observable traits.
추천 영상:
가이드 코스
03:03
New Alleles and Migration

Phenotypic Ratios

Phenotypic ratios describe the relative frequencies of different phenotypes in a population resulting from genetic crosses. In the F₂ generation, the observed phenotypic ratios can be analyzed to infer the underlying genotypes. For example, the presence of pink, light pink, and red kernels suggests a blend of dominant and recessive alleles, which can be quantified to understand the inheritance pattern and validate Mendelian predictions.
추천 영상:
가이드 코스
10:48
Mutations and Phenotypes
관련 실천
교과서 질문

In a line of cherry tomatoes, the average fruit weight is 16 g. A plant producing tomatoes with an average weight of 12 g is used in one self-fertilization cross to produce a line of smaller tomatoes, and a plant producing tomatoes of 24 g is used in a second cross to produce larger tomatoes. If narrow sense heritability (h²) for this trait is 0.80, what are the expected responses to selection (R) for fruit weight in the crosses?

434
views
교과서 질문

Two pure-breeding wheat strains, one producing dark red kernels and the other producing white kernels, are crossed to produce F₁ with pink kernel color. When an F₁ plant is self-fertilized and its seed collected and planted, the resulting F₂ consists of 160 plants with kernel colors as shown in the following table.

Based on the F₂ progeny, how many genes are involved in kernel color determination?

464
views
교과서 질문

Two pure-breeding wheat strains, one producing dark red kernels and the other producing white kernels, are crossed to produce F₁ with pink kernel color. When an F₁ plant is self-fertilized and its seed collected and planted, the resulting F₂ consists of 160 plants with kernel colors as shown in the following table.

How many additive alleles are required to explain the five phenotypes seen in the F₂?

466
views
교과서 질문

In studies of human MZ and DZ twin pairs of the same sex who are reared together, the following concordance values are identified for various traits. Based on the values shown, describe the relative importance of genes versus the influence of environmental factors for each trait.

484
views
교과서 질문

During a visit, your grandparents comment on how tall you are compared with them. You tell them that in your genetics class, you learned that height in humans has high heritability, although environmental factors also influence adult height. You correctly explain the meaning of heritability, and your grandfather asks, 'How can height be highly heritable and still be influenced by the environment?' What explanation do you give your grandfather?

411
views
교과서 질문

Two pure-breeding wheat strains, one producing dark red kernels and the other producing white kernels, are crossed to produce F₁ with pink kernel color. When an F₁ plant is self-fertilized and its seed collected and planted, the resulting F₂ consists of 160 plants with kernel colors as shown in the following table.

If an F₁ plant is crossed to a dark red plant, what are the expected progeny phenotypes, and what is the expected proportion of each phenotype?

437
views