Ch. 5 - Genetic Linkage and Mapping in Eukaryotes
Sanders - Genetic Analysis: An Integrated Approach 3rd Edition
Sanders3rd EditionGenetic Analysis: An Integrated ApproachISBN: 9780135564172당신이 사용하는 게 아니라요?교과서 변경
5장, 문제 32b

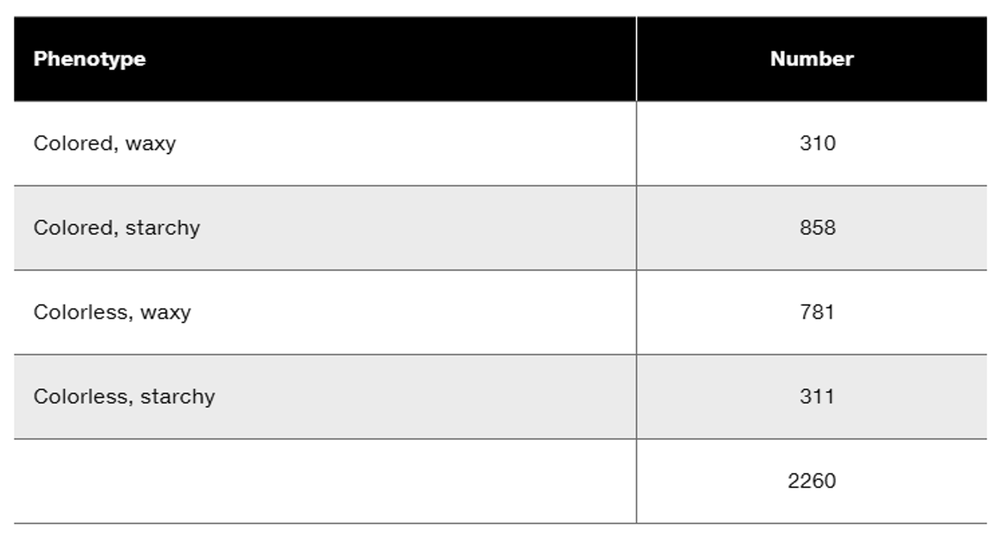
In experiments published in 1918 that sought to verify and expand the genetic linkage and recombination theory proposed by Morgan, Thomas Bregger studied potential genetic linkage in corn (Zea mays) for genes controlling kernel color (colored is dominant to colorless) and starch content (starchy is dominant to waxy). Bregger performed two crosses. In Cross 1, pure-breeding colored, starchy-kernel plants (C1 Wx/C1 Wx) were crossed to plants pure-breeding for colorless, waxy kernels (c1 wx/c1 wx). The F₁ of this cross were test-crossed to colorless, waxy plants. The test-cross progeny were as follows:
Table displaying phenotypes and their corresponding numbers from genetic mapping experiments in corn.
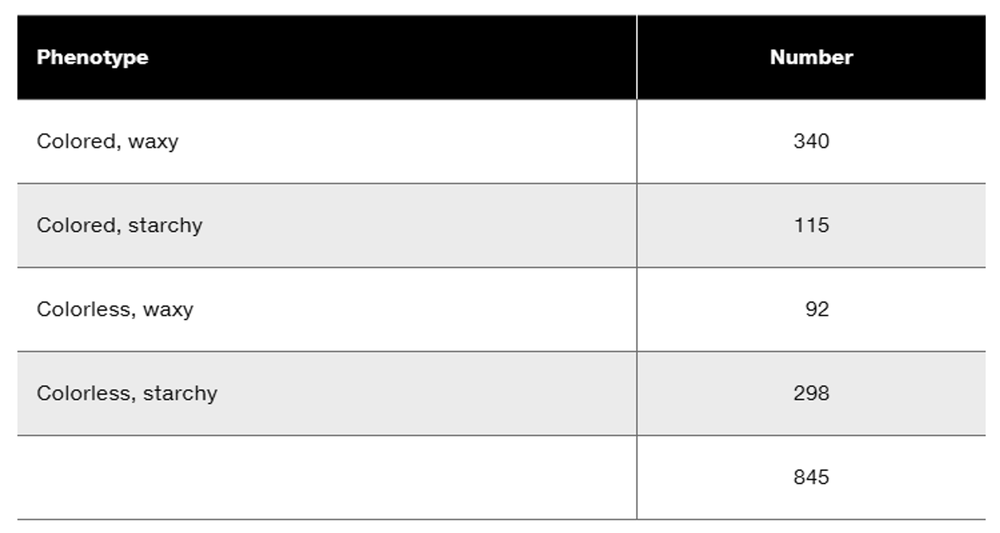
In Cross 2, plants pure-breeding for colored, waxy kernels (C1 wx/C1 wx) and colorless, starchy kernels (c1 Wx/c1 Wx) were mated, and their F₁ were test-crossed to colorless, waxy plants. The test-cross progeny were as follows:
Table displaying phenotypes and their corresponding numbers: Colored, waxy 340; Colored, starchy 115; Colorless, waxy 92; Colorless, starchy 298.
Calculate the recombination frequency for each of the progeny groups.

검증된 단계별 안내
1
Step 1: Understand the problem. The goal is to calculate the recombination frequency for each cross. Recombination frequency is calculated as the number of recombinant progeny divided by the total number of progeny, multiplied by 100 to express it as a percentage.
Step 2: Identify the parental and recombinant phenotypes. Parental phenotypes are the ones that match the original parental combinations, while recombinant phenotypes are the new combinations resulting from crossing over. For Cross 1, parental phenotypes are 'Colored, starchy' and 'Colorless, waxy,' while recombinant phenotypes are 'Colored, waxy' and 'Colorless, starchy.' Similarly, identify parental and recombinant phenotypes for Cross 2.
Step 3: Count the number of recombinant progeny. For Cross 1, add the numbers of 'Colored, waxy' and 'Colorless, starchy' progeny. For Cross 2, add the numbers of 'Colored, starchy' and 'Colorless, waxy' progeny.
Step 4: Calculate the total number of progeny for each cross. Add all the progeny numbers for Cross 1 and Cross 2 separately.
Step 5: Use the formula for recombination frequency: \( \text{Recombination Frequency} = \frac{\text{Number of Recombinant Progeny}}{\text{Total Number of Progeny}} \times 100 \). Perform this calculation for both Cross 1 and Cross 2 to determine the recombination frequencies.

비슷한 문제에 대한 검증된 영상 답변:

이 영상 해법은 위 문제에 도움이 된다고 튜터들이 추천한 것입니다.
영상 길이:
5m
도움이 되었나요?

주요 개념

질문에 올바르게 답하기 위해 반드시 이해해야 하는 핵심 개념들은 다음과 같습니다.

Genetic Linkage

Genetic linkage refers to the tendency of genes located close to each other on a chromosome to be inherited together during meiosis. This phenomenon occurs because linked genes are less likely to be separated by recombination events. Understanding genetic linkage is crucial for predicting the inheritance patterns of traits, as it affects the ratios of phenotypes observed in offspring.
추천 영상:
가이드 코스
07:33
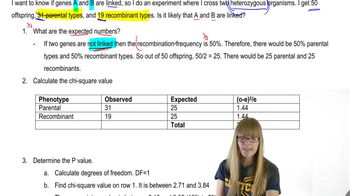
Chi Square and Linkage

Recombination Frequency

Recombination frequency is a measure of the likelihood that two genes will be separated during meiosis due to crossing over. It is calculated by dividing the number of recombinant offspring by the total number of offspring, then multiplying by 100 to express it as a percentage. This frequency helps in constructing genetic maps and understanding the distance between genes on a chromosome.
추천 영상:
가이드 코스
03:51
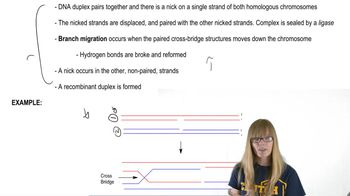
Recombination after Single Strand Breaks

Test Cross

A test cross is a breeding experiment used to determine the genotype of an individual with a dominant phenotype. This is achieved by crossing the individual with a homozygous recessive individual. The phenotypic ratios of the offspring provide insights into whether the dominant individual is homozygous or heterozygous, which is essential for understanding inheritance patterns in genetic studies.
추천 영상:
가이드 코스
26:08
Trihybrid Cross
관련 실천
교과서 질문

A genetic study of an early onset form of heart disease identifies 10 families containing members with the condition. No clear dominant or recessive pattern of inheritance is evident, but an analysis of SNP markers for five families detects a strong association with a marker on chromosome 12, and genetic linkage analysis for the marker produces a lod score of 2.2.


What next step do you recommend for this genetic analysis?

426
views
교과서 질문

In experiments published in 1918 that sought to verify and expand the genetic linkage and recombination theory proposed by Morgan, Thomas Bregger studied potential genetic linkage in corn (Zea mays) for genes controlling kernel color (colored is dominant to colorless) and starch content (starchy is dominant to waxy). Bregger performed two crosses. In Cross 1, pure-breeding colored, starchy-kernel plants (C1 Wx/C1 Wx) were crossed to plants pure-breeding for colorless, waxy kernels (c1 wx/c1 wx). The F₁ of this cross were test-crossed to colorless, waxy plants. The test-cross progeny were as follows:

In Cross 2, plants pure-breeding for colored, waxy kernels (C1 wx/C1 wx) and colorless, starchy kernels (c1 Wx/c1 Wx) were mated, and their F₁ were test-crossed to colorless, waxy plants. The test-cross progeny were as follows:

For each set of test-cross progeny, determine whether genetic linkage or independent assortment is more strongly supported by the data. Explain the rationale for your answer.

405
views
교과서 질문

In experiments published in 1918 that sought to verify and expand the genetic linkage and recombination theory proposed by Morgan, Thomas Bregger studied potential genetic linkage in corn (Zea mays) for genes controlling kernel color (colored is dominant to colorless) and starch content (starchy is dominant to waxy). Bregger performed two crosses. In Cross 1, pure-breeding colored, starchy-kernel plants (C1 Wx/C1 Wx) were crossed to plants pure-breeding for colorless, waxy kernels (c1 wx/c1 wx). The F₁ of this cross were test-crossed to colorless, waxy plants. The test-cross progeny were as follows:

In Cross 2, plants pure-breeding for colored, waxy kernels (C1 wx/C1 wx) and colorless, starchy kernels (c1 Wx/c1 Wx) were mated, and their F₁ were test-crossed to colorless, waxy plants. The test-cross progeny were as follows:

Merge the two sets of progeny data and determine the combined recombination frequency.

532
views
교과서 질문

A genetic study of an early onset form of heart disease identifies 10 families containing members with the condition. No clear dominant or recessive pattern of inheritance is evident, but an analysis of SNP markers for five families detects a strong association with a marker on chromosome 12, and genetic linkage analysis for the marker produces a lod score of 2.2.


What do the association and lod score results suggest about this genetic marker?

531
views
교과서 질문

In experiments published in 1918 that sought to verify and expand the genetic linkage and recombination theory proposed by Morgan, Thomas Bregger studied potential genetic linkage in corn (Zea mays) for genes controlling kernel color (colored is dominant to colorless) and starch content (starchy is dominant to waxy). Bregger performed two crosses. In Cross 1, pure-breeding colored, starchy-kernel plants (C1 Wx/C1 Wx) were crossed to plants pure-breeding for colorless, waxy kernels (c1 wx/c1 wx). The F₁ of this cross were test-crossed to colorless, waxy plants. The test-cross progeny were as follows:

In Cross 2, plants pure-breeding for colored, waxy kernels (C1 wx/C1 wx) and colorless, starchy kernels (c1 Wx/c1 Wx) were mated, and their F₁ were test-crossed to colorless, waxy plants. The test-cross progeny were as follows:

Taken together, are the results of these two experiments compatible with the hypothesis of genetic linkage? Explain why or why not.

473
views
교과서 질문

DNA sequences for 10 individuals are

Identify the nucleotide positions of all SNPs (single nucleotide polymorphisms).

472
views