
교과서 질문
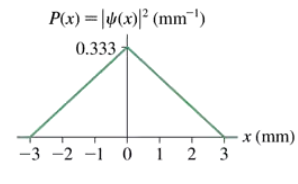
FIGURE EX39.14 is a graph of |ψ(x)|2 for an electron. What is the probability that the electron is located between x = 1.0 nm and x = 2.0 nm?
1296
views

 검증된 단계별 안내
 8:13
8:13
 08:17
08:17 8:42
8:42FIGURE EX39.14 is a graph of |ψ(x)|2 for an electron. What is the probability that the electron is located between x = 1.0 nm and x = 2.0 nm?
An experiment has four possible outcomes, labeled A to D. The probability of A is PA = 40% and of B is PB = 30%. Outcome C is twice as probable as outcome D. What are the probabilities PC and PD?
FIGURE EX39.13 shows the probability density for an electron that has passed through an experimental apparatus. What is the probability that the electron will land in a 0.010-mm-wide strip at x = 0.000 mm?
When 5×10¹² photons pass through an experimental apparatus, 2.0×10⁹ land in a 0.10-mm-wide strip. What is the probability density at this point?
In one experiment, 2000 photons are detected in a 0.10-mm-wide strip where the amplitude of the electromagnetic wave is 10 V/m. How many photons are detected in a nearby 0.10-mm-wide strip where the amplitude is 30 V/m?
FIGURE EX39.14 is a graph of |ψ(x)|2 for an electron. What is the value of a?