Ch 02: Motion Along a Straight Line
Young & Freedman Calc - University Physics 14th Edition
Young & Freedman Calc14th EditionUniversity PhysicsISBN: 9780321973610당신이 사용하는 게 아니라요?교과서 변경
2장, 문제 10c

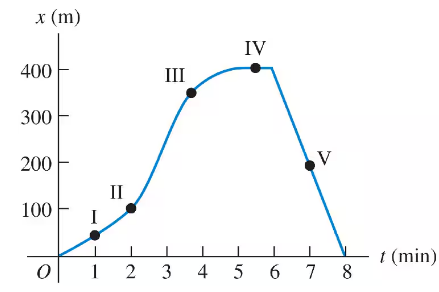
A physics professor leaves her house and walks along the sidewalk toward campus. After 55 min, it starts to rain, and she returns home. Her distance from her house as a function of time is shown in Fig. E2.102.10. At which of the labeled points is her velocity constant and negative?
Position-time graph showing a curve with labeled points I to V; velocity is zero at point IV.

검증된 단계별 안내
1
To determine where the velocity is constant and negative, we need to analyze the slope of the distance-time graph. A constant velocity corresponds to a straight line segment on the graph.
A negative velocity indicates that the slope of the line is negative, meaning the line is sloping downwards as time progresses.
Examine the graph and identify the segments where the line is straight and sloping downwards. This will indicate a constant negative velocity.
From the graph, observe the segment between points 'c' and 'b'. This segment is a straight line with a negative slope, indicating a constant negative velocity.
Therefore, the velocity is constant and negative between points 'c' and 'b'.

비슷한 문제에 대한 검증된 영상 답변:

이 영상 해법은 위 문제에 도움이 된다고 튜터들이 추천한 것입니다.
영상 길이:
3m
도움이 되었나요?

주요 개념

질문에 올바르게 답하기 위해 반드시 이해해야 하는 핵심 개념들은 다음과 같습니다.

Velocity

Velocity is a vector quantity that describes the rate of change of position with respect to time, including both speed and direction. In the context of the graph, velocity is represented by the slope of the line. A constant negative velocity indicates a straight line with a downward slope, showing movement in the opposite direction.
추천 영상:
가이드 코스
7:27
Escape Velocity

Position-Time Graph

A position-time graph displays an object's position relative to time, allowing analysis of motion characteristics such as velocity and acceleration. The slope of the graph at any point indicates the object's velocity. A negative slope signifies movement back toward the starting point, while a constant slope indicates uniform motion.
추천 영상:
가이드 코스
03:04
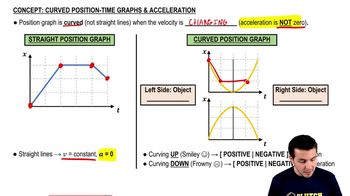
Curved Position-Time Graphs & Acceleration

Slope of a Line

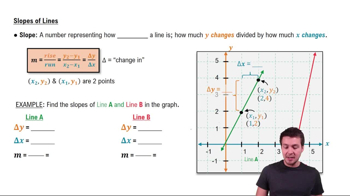
The slope of a line on a graph represents the rate of change between the variables on the axes. In a position-time graph, the slope corresponds to velocity. A negative slope indicates a decrease in position over time, meaning the object is moving back toward its starting point. A constant slope implies uniform velocity.
추천 영상:
가이드 코스
01:29
Slopes of Lines
관련 실천
교과서 질문

The table shows test data for the Bugatti Veyron Super Sport, the fastest street car made. The car is moving in a straight line (the xx-axis).

(a) Sketch a vxv_{x}-tt graph of this car's velocity (in mi/h) as a function of time. Is its acceleration constant?

(b) Calculate the car's average acceleration (in m/s2) between (i) 00 and 2.12.1 s; (ii) 2.12.1 s and 20.020.0 s; (iii) 20.020.0 s and 5353 s. Are these results consistent with your graph in part (a)? (Before you decide to buy this car, it might be helpful to know that only 300300 will be built, it runs out of gas in 1212 minutes at top speed, and it costs more than $1.5\$1.5 million!)

1729
views
교과서 질문

A physics professor leaves her house and walks along the sidewalk toward campus. After 55 min, it starts to rain, and she returns home. Her distance from her house as a function of time is shown in Fig. E2.102.10. At which of the labeled points is her velocity constant and positive?

1780
views
교과서 질문

A physics professor leaves her house and walks along the sidewalk toward campus. After 55 min, it starts to rain, and she returns home. Her distance from her house as a function of time is shown in Fig. E2.102.10. At which of the labeled points is her velocity zero?

1321
views
교과서 질문

A race car starts from rest and travels east along a straight and level track. For the first 5.05.0 s of the car's motion, the eastward component of the car's velocity is given by vx(t)=v_{x}(t)= (0.8600.860 m/s3)t2. What is the acceleration of the car when vx=12.0v_{x}=12.0 m/s?

4406
views
2
rank
교과서 질문

A physics professor leaves her house and walks along the sidewalk toward campus. After 55 min, it starts to rain, and she returns home. Her distance from her house as a function of time is shown in Fig. E2.102.10. At which of the labeled points is her velocity decreasing in magnitude?

1186
views
교과서 질문

A ball moves in a straight line (the xx-axis). The graph in Fig. E2.92.9 shows this ball's velocity as a function of time. What are the ball's average speed and average velocity during the first 3.03.0 s?

4501
views
1
rank