

Ch. 3 - Probability
Larson - Elementary Statistics: Picturing the World 8th Edition
Larson8th EditionElementary Statistics: Picturing the WorldISBN: 9780137493470당신이 사용하는 게 아니라요?교과서 변경
3장, 문제 3.1.77

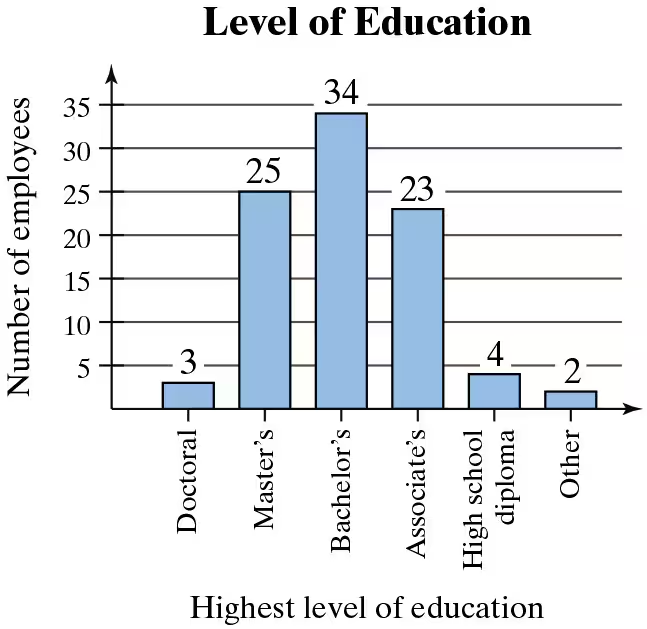
Using a Bar Graph to Find Probabilities In Exercises 75-78, use the bar graph at the left, which shows the highest level of education received by employees of a company. Find the probability that the highest level of education for an employee chosen at random is
77. a master's degree.
Bar graph showing the number of employees by highest level of education: Doctoral 3, Master's 25, Bachelor's 34, Associate's 23, High school diploma 4, Other 2.

검증된 단계별 안내
1
Step 1: Identify the total number of employees in the company by summing the frequencies of all education levels shown in the bar graph. Add the values: 3 (Doctoral) + 25 (Master's) + 34 (Bachelor's) + 23 (Associate's) + 4 (High school diploma) + 2 (Other).
Step 2: Determine the number of employees whose highest level of education is a master's degree. From the bar graph, this value is 25.
Step 3: Calculate the probability of randomly selecting an employee whose highest level of education is a master's degree. Use the formula for probability: \( P = \frac{\text{Number of favorable outcomes}}{\text{Total number of outcomes}} \). Substitute the values: \( P = \frac{25}{\text{Total number of employees}} \).
Step 4: Simplify the fraction obtained in Step 3, if necessary, to express the probability in its simplest form.
Step 5: Interpret the result as the likelihood of randomly selecting an employee with a master's degree, ensuring the probability is expressed as a fraction, decimal, or percentage depending on the context.

비슷한 문제에 대한 검증된 영상 답변:

이 영상 해법은 위 문제에 도움이 된다고 튜터들이 추천한 것입니다.
영상 길이:
1m
도움이 되었나요?

주요 개념

질문에 올바르게 답하기 위해 반드시 이해해야 하는 핵심 개념들은 다음과 같습니다.

Probability

Probability is a measure of the likelihood that a particular event will occur, expressed as a number between 0 and 1. In this context, it refers to the chance of randomly selecting an employee with a specific highest level of education, such as a master's degree. The probability can be calculated by dividing the number of employees with that education level by the total number of employees.
추천 영상:
5:37
Introduction to Probability

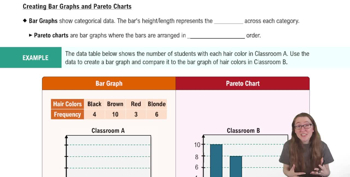
Bar Graph

A bar graph is a visual representation of data using rectangular bars to show the frequency or count of different categories. In this case, the bar graph illustrates the number of employees corresponding to various highest levels of education. Each bar's height represents the number of employees, making it easy to compare the different education levels at a glance.
추천 영상:
04:52
Creating Bar Graphs and Pareto Charts

Total Count

The total count refers to the sum of all individuals represented in the data set. For this question, it is the total number of employees across all education levels shown in the bar graph. This total is essential for calculating probabilities, as it serves as the denominator when determining the likelihood of selecting an employee with a specific educational background.
추천 영상:
04:04
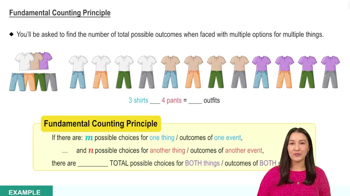
Fundamental Counting Principle