In Exercises 21–40, eliminate the parameter t. Then use the rectangular equation to sketch the plane curve represented by the given parametric equations. Use arrows to show the orientation of the curve corresponding to increasing values of t. (If an interval for t is not specified, assume that −∞ < t < ∞. x = t, y = 2t
Ch. 5 - Complex Numbers, Polar Coordinates and Parametric Equations

5장, 문제 19
In Exercises 9–20, use point plotting to graph the plane curve described by the given parametric equations. Use arrows to show the orientation of the curve corresponding to increasing values of t. x = 2t, y = |t − 1|; −∞ < t < ∞
검증된 단계별 안내1
Understand the parametric equations given: \(x = 2t\) and \(y = |t - 1|\), where \(t\) ranges over all real numbers from \(-\infty\) to \(\infty\). The goal is to plot points \((x, y)\) on the plane as \(t\) changes and show the direction of increasing \(t\).
Recognize that \(y = |t - 1|\) is a piecewise function. For \(t < 1\), \(y = 1 - t\), and for \(t \geq 1\), \(y = t - 1\). This will affect how the curve behaves on either side of \(t = 1\).
Create a table of values by choosing several values of \(t\) (for example, \(t = 0, 0.5, 1, 1.5, 2\) and also some negative values like \(t = -1, -0.5\)). For each \(t\), calculate \(x = 2t\) and \(y = |t - 1|\) to get points \((x, y)\) to plot.
Plot the points on the coordinate plane using the calculated \((x, y)\) pairs. Connect the points smoothly, keeping in mind the piecewise nature of \(y\) and that the curve will have a 'V' shape due to the absolute value.
Add arrows along the curve to indicate the orientation corresponding to increasing \(t\). Since \(x = 2t\) increases as \(t\) increases, the arrows should point from left to right along the curve.

비슷한 문제에 대한 검증된 영상 답변:
이 영상 해법은 위 문제에 도움이 된다고 튜터들이 추천한 것입니다.
영상 길이:
7m도움이 되었나요?
주요 개념
질문에 올바르게 답하기 위해 반드시 이해해야 하는 핵심 개념들은 다음과 같습니다.
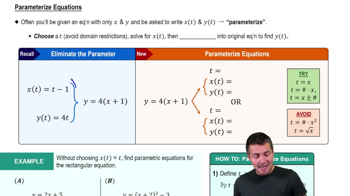
Parametric Equations
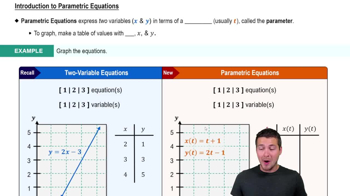
Parametric equations express the coordinates of points on a curve as functions of a parameter, usually denoted t. Instead of y as a function of x, both x and y depend on t, allowing the description of more complex curves and motions.
추천 영상:
Parameterizing Equations
Graphing Parametric Curves
To graph parametric curves, plot points (x(t), y(t)) for various values of t and connect them smoothly. This method helps visualize the shape and behavior of the curve, especially when y is not a single-valued function of x.
추천 영상:
Introduction to Parametric Equations
Orientation and Direction of Parametric Curves
Orientation indicates the direction in which the curve is traced as the parameter t increases. Using arrows on the graph shows this direction, which is important for understanding the curve's progression and any time-dependent phenomena.
추천 영상:
Introduction to Parametric Equations
관련 실천
교과서 질문
753
views
교과서 질문
In Exercises 11–26, plot each complex number. Then write the complex number in polar form. You may express the argument in degrees or radians. −3
434
views
교과서 질문
In Exercises 13–34, test for symmetry and then graph each polar equation. r = 1 + 2 cos θ
769
views
교과서 질문
In Exercises 13–34, test for symmetry and then graph each polar equation. r = 2 + cos θ
704
views
교과서 질문
In Exercises 21–26, use a polar coordinate system like the one shown for Exercises 1–10 to plot each point with the given polar coordinates. Then find another representation of this point in which
a. r>0, 2π < θ < 4π.
b. r<0, 0. < θ < 2π.
c. r>0, −2π. < θ < 0.
(5, π/6)
742
views
교과서 질문
In Exercises 9–20, find each product and write the result in standard form. (2 + 3i)²
690
views
