In Exercises 21–40, eliminate the parameter t. Then use the rectangular equation to sketch the plane curve represented by the given parametric equations. Use arrows to show the orientation of the curve corresponding to increasing values of t. (If an interval for t is not specified, assume that −∞ < t < ∞. x = t, y = 2t

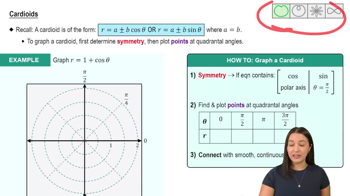
In Exercises 13–34, test for symmetry and then graph each polar equation. r = 1 + 2 cos θ
검증된 단계별 안내
비슷한 문제에 대한 검증된 영상 답변:
주요 개념
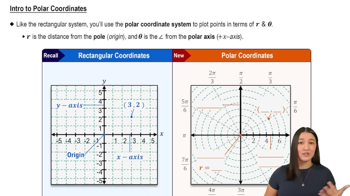
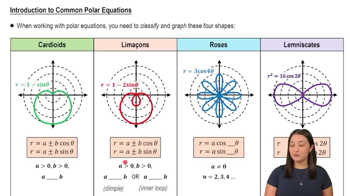
Polar Coordinates and Equations
Symmetry Tests in Polar Graphs
Graphing Polar Equations Involving Cosine
In Exercises 11–26, plot each complex number. Then write the complex number in polar form. You may express the argument in degrees or radians. −3
In Exercises 21–28, divide and express the result in standard form. 2 / 3 - i
In Exercises 9–20, use point plotting to graph the plane curve described by the given parametric equations. Use arrows to show the orientation of the curve corresponding to increasing values of t. x = 2t, y = |t − 1|; −∞ < t < ∞
In Exercises 13–34, test for symmetry and then graph each polar equation. r = 2 + cos θ
In Exercises 21–26, use a polar coordinate system like the one shown for Exercises 1–10 to plot each point with the given polar coordinates. Then find another representation of this point in which
a. r>0, 2π < θ < 4π.
b. r<0, 0. < θ < 2π.
c. r>0, −2π. < θ < 0.
(5, π/6)
