 Back
Set Applications: Survey Problems and Venn Diagrams
Study Guide - Smart Notes
 Tailored notes based on your materials, expanded with key definitions, examples, and context.
Set Applications: Survey Problems
Introduction to Survey Problems
Survey problems in mathematics often involve analyzing data about participants' preferences or behaviors. These problems are commonly solved using Venn diagrams, which visually represent the relationships between different sets and their intersections. Venn diagrams help to clarify how many participants belong to each set, overlap between sets, and the total number of participants.
Venn Diagrams of Survey Results
Venn diagrams are a powerful tool for displaying survey results. Each circle represents a set (e.g., people who enjoy a particular activity), and the overlapping regions show participants who belong to multiple sets. The universal set U includes all survey participants.
Key Point 1: The number in each region of the Venn diagram represents the count of participants in that specific group or intersection.
Key Point 2: To find the number of participants in a particular group, sum the numbers in the relevant regions.
Example: If 26 people enjoy running, 18 enjoy cycling, and 16 enjoy both, the Venn diagram will show these numbers in the appropriate regions.
Practice: Exercise Preferences
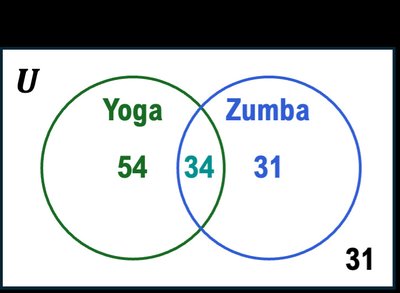
Survey data can be used to answer questions about group membership and overlaps. For example, a fitness center surveyed its members about Yoga and Zumba classes. The Venn diagram below shows the distribution:
How many members attend Yoga classes? Add the numbers in the Yoga circle (including overlap):
How many total members were surveyed? Add all regions:
How many members attend at least one class? Add all regions except those outside both circles:
Advanced Survey Problems: Multiple Sets
Survey with Three Sets
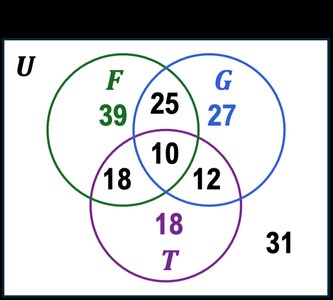
When survey data involves three sets, Venn diagrams become more complex, showing all possible intersections. For example, a survey of 180 college students asked about the use of flashcards (F), study groups (G), and tutoring (T).
How many students use flashcards? Add all regions in the F circle:
How many students use study groups and tutoring? Add regions where both G and T overlap:
How many students use at least 2 study methods? Add all regions where at least two circles overlap:
Creating Venn Diagrams from Survey Data
To create a Venn diagram from survey data, follow these steps:
Define sets and draw the Venn diagram. For example, let U be the set of all responses, and define sets for each category (e.g., fiction and non-fiction readers).
For each region: Start with the innermost region (intersection of all sets), then subtract to avoid double-counting.
Label each region with the correct number of responses.
Answer questions about the survey using the diagram.
Example: In a survey of 150 students, 95 read fiction, 70 read non-fiction, and 32 read both. The Venn diagram helps determine how many read only fiction, only non-fiction, both, or neither.
Survey Problems with Three Sets: Retail Example
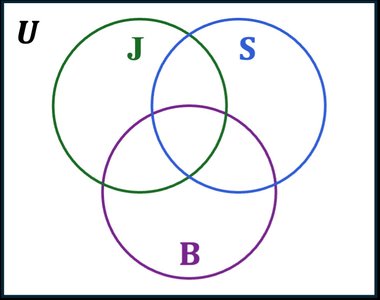
Retail surveys often track purchases across multiple product categories. For example, a store tracked purchases of jackets (J), sneakers (S), and backpacks (B) among 200 customers. The Venn diagram below is used to represent the data:
Key Point: Each region in the diagram corresponds to a unique combination of purchases (e.g., jackets only, jackets and sneakers, all three items).
Example: If 90 purchased jackets, 75 purchased sneakers, 60 purchased backpacks, 30 purchased jackets and sneakers, 25 jackets and backpacks, 20 sneakers and backpacks, and 12 all three items, the diagram helps answer questions about exclusive and overlapping purchases.
Mathematical Formulas for Survey Problems
Formulas for Two Sets
To calculate the number of elements in the union or intersection of two sets:
Union:
Intersection: is the number in both sets.
Formulas for Three Sets
For three sets, the formula for the union is:
Applications and Importance
Why Use Venn Diagrams?
Venn diagrams are essential for visualizing relationships between sets, avoiding double-counting, and answering complex survey questions. They are widely used in mathematics, statistics, business, and social sciences to analyze data and make informed decisions.
Summary Table: Venn Diagram Regions and Their Meanings
Region | Meaning |
|---|---|
Single Set | Participants in only one category |
Intersection | Participants in multiple categories |
Outside Circles | Participants in none of the categories |
