A parabolic graph showing how tax revenue first rises then falls as tax rates increase, illustrating the non-linear relationship between tax size and government revenue.
Tax Revenue
The total funds collected by the government from taxes, calculated as the tax amount per unit multiplied by the quantity exchanged.
Quantity Exchanged
The number of units bought and sold in a market, which decreases as taxes increase due to higher costs for buyers and lower returns for sellers.
Demand Curve
A downward-sloping line representing the relationship between price and quantity demanded by consumers in a market.
Supply Curve
An upward-sloping line showing the relationship between price and quantity supplied by producers in a market.
Equilibrium
The market point where the quantity demanded equals the quantity supplied, before any tax is imposed.
Per Unit Tax
A fixed amount charged on each unit sold, affecting both the price buyers pay and the price sellers receive.
Downward Slope
The portion of the Laffer Curve where increasing tax rates lead to lower tax revenue due to reduced market activity.
Parabolic Graph
A curve shaped like an arch, used to depict the Laffer Curve’s rise and fall of tax revenue with changing tax rates.
Arthur Laffer
The economist who conceptualized the relationship between tax rates and tax revenue, giving his name to the Laffer Curve.
Optimal Tax Policy
A strategy aiming to set tax rates at a level that maximizes government revenue without excessively discouraging economic transactions.
Tax Size
The magnitude of the tax imposed per unit, influencing both the price structure and the quantity exchanged in the market.
Price Paid by Buyers
The final amount consumers pay after a tax is added, which rises as tax rates increase.
Price Received by Sellers
The net amount producers get after the tax is deducted from the sale price, which falls as tax rates increase.
Maximizing Tax Revenue
The point on the Laffer Curve where the combination of tax rate and quantity exchanged yields the highest possible government income.
 Back
Back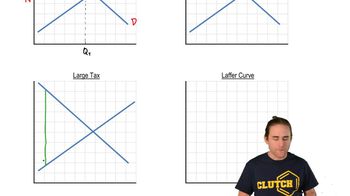
 09:01
09:01