 Back
BackDynamics of Microbial Growth: Growth Curves, Generation Time, and Quantification Methods
Study Guide - Smart Notes
 Tailored notes based on your materials, expanded with key definitions, examples, and context.
Dynamics of Microbial Growth
Microbial Growth and Generation Time
Microbial growth refers to the increase in the number of cells in a population. Bacteria typically reproduce by binary fission, leading to exponential population growth under optimal conditions. The generation time is the time required for a microbial population to double in number.
Exponential Growth: Each generation doubles the number of cells, resulting in a geometric progression (e.g., 1, 2, 4, 8, 16, ...).
Generation Number: The number of times the population has doubled.
Logarithmic Representation: Growth is often plotted on a logarithmic scale to visualize the rapid increase in cell numbers.
Mathematical Expression: The number of cells after n generations can be calculated as where is the initial number of cells and is the number of generations.
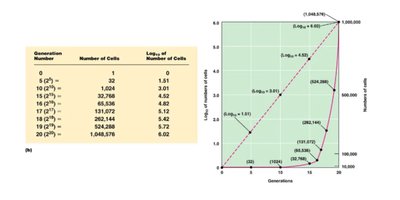
Example: After 20 generations, a single bacterium can produce over one million cells, as shown in the table and graph above.
Bacterial Growth Curve
The bacterial growth curve describes the growth of a bacterial population over time in a closed system (batch culture). It consists of four distinct phases:
Lag Phase: Cells adapt to new environment; little or no cell division occurs.
Log (Exponential) Phase: Cells divide at a constant and rapid rate; population doubles at regular intervals (generation time is shortest here).
Stationary Phase: Growth rate slows as nutrients are depleted and waste products accumulate; number of new cells equals number of dying cells.
Death Phase: Cells die at an exponential rate due to lack of nutrients and accumulation of toxic products.
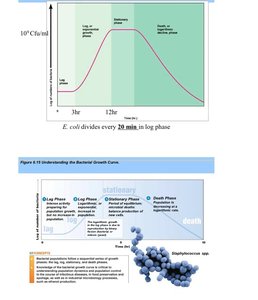
Key Point: Escherichia coli can divide every 20 minutes during the log phase under optimal conditions.
Understanding the Bacterial Growth Curve
The bacterial growth curve is fundamental for understanding microbial physiology and for designing experiments in microbiology. Each phase reflects changes in cell metabolism and population dynamics.
Lag Phase: Synthesis of enzymes and molecules needed for growth.
Log Phase: Maximum metabolic activity; cells are most susceptible to antibiotics targeting cell wall synthesis.
Stationary Phase: Secondary metabolites (e.g., antibiotics) may be produced.
Death Phase: Cell lysis and decline in viable cell count.
Example: The stationary phase is important in industrial microbiology for the production of certain metabolites.
Quantifying Microbial Growth: Serial Dilution and Plate Counting
To estimate the number of viable bacteria in a sample, microbiologists use the serial dilution and plate count method. This technique involves diluting a sample in a stepwise manner and plating aliquots to count colony-forming units (CFUs).
Serial Dilution: The original sample is diluted in tenfold steps (e.g., 1:10, 1:100, 1:1,000, etc.).
Plating: A measured volume from each dilution is spread on an agar plate.
Counting Colonies: After incubation, colonies are counted. Each colony represents a single viable cell from the original sample.
Calculation: The number of bacteria per milliliter in the original sample is calculated as:
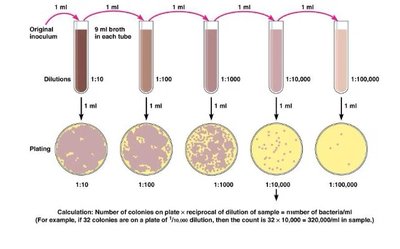
Example: If 32 colonies are counted on a plate from a 1/10,000 dilution, the original sample contains bacteria/mL.
Summary Table: Bacterial Growth Phases
Phase | Description | Key Features |
|---|---|---|
Lag | Adaptation to environment | Little/no cell division, metabolic activity high |
Log | Exponential growth | Rapid cell division, shortest generation time |
Stationary | Growth rate slows | Nutrient depletion, waste accumulation, equilibrium |
Death | Exponential cell death | Cells die due to harsh conditions |
