 Back
BackMicrobial Metabolism: Catabolic and Anabolic Pathways
Study Guide - Smart Notes
 Tailored notes based on your materials, expanded with key definitions, examples, and context.
Microbial Metabolism
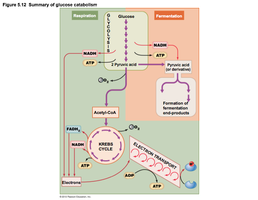
Summary of Glucose Catabolism
Microbial cells utilize glucose as a primary energy source, breaking it down through catabolic pathways to generate ATP. The two main routes are respiration and fermentation, each with distinct end products and energy yields.
Respiration: Complete oxidation of glucose to CO2 and H2O, yielding high ATP.
Fermentation: Partial oxidation, yielding less ATP and organic end-products.
Key Intermediates: Glycolysis produces pyruvic acid, which enters either the Krebs cycle (respiration) or fermentation pathways.
Electron carriers: NAD+ and FAD are reduced during catabolism, transferring electrons to the electron transport chain or fermentation end-products.
Electron Transport Chain (ETC)
The electron transport chain is a series of carrier molecules embedded in cellular membranes that transfer electrons from NADH and FADH2 to a final electron acceptor. This process generates a proton gradient used to synthesize ATP.
Location: Inner mitochondrial membrane (eukaryotes), cytoplasmic membrane (prokaryotes).
Carrier Molecules: Flavoproteins, ubiquinones, metal-containing proteins, cytochromes.
Aerobic Respiration: Oxygen is the final electron acceptor.
Anaerobic Respiration: Other molecules (e.g., NO3-, SO42-) serve as final electron acceptors.
Chemiosmosis and ATP Generation
Chemiosmosis refers to the use of a proton gradient across a membrane to drive ATP synthesis. The energy released from electron transfer in the ETC is used to pump protons, creating an electrochemical gradient. ATP synthase uses this gradient to phosphorylate ADP.
Oxidative Phosphorylation: ATP synthesis driven by ETC-generated proton gradient.
ATP Yield: Up to ~34 ATP per glucose in prokaryotic aerobic respiration.
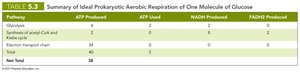
Summary of Ideal Prokaryotic Aerobic Respiration
The following table summarizes ATP and electron carrier yields from each stage of prokaryotic aerobic respiration of one glucose molecule:
Pathway | ATP Produced | ATP Used | NADH Produced | FADH2 Produced |
|---|---|---|---|---|
Glycolysis | 4 | 2 | 2 | 0 |
Synthesis of acetyl-CoA and Krebs cycle | 2 | 0 | 8 | 2 |
Electron transport chain | 34 | 0 | 0 | 0 |
Total | 40 | 2 | 10 | 2 |
Net Total | 38 |
Fermentation
Fermentation is an alternative pathway for energy generation when cells cannot fully oxidize glucose via respiration. It regenerates NAD+ by transferring electrons to organic molecules, producing various end-products.
Partial oxidation: Only part of the energy in glucose is released.
Final electron acceptor: Organic molecules from within the cell.
ATP yield: Much lower than respiration.
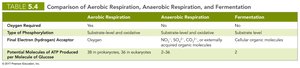
Comparison of Catabolic Pathways
The following table compares aerobic respiration, anaerobic respiration, and fermentation:
Aerobic Respiration | Anaerobic Respiration | Fermentation | |
|---|---|---|---|
Oxygen Required | Yes | No | No |
Type of Phosphorylation | Substrate-level and oxidative | Substrate-level and oxidative | Substrate-level |
Final Electron Acceptor | Oxygen | NO3-, SO42-, CO2, externally acquired organic molecules | Cellular organic molecules |
Potential ATP per Glucose | 38 (prokaryotes), 36 (eukaryotes) | 2-36 | 2 |
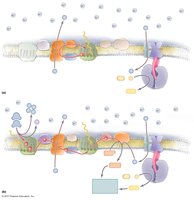
Electron Transport Chain Structure
The ETC consists of multiple protein complexes and carriers embedded in the membrane, facilitating electron transfer and proton pumping.
Complexes: Each complex accepts and donates electrons, contributing to the proton gradient.
ATP synthase: Utilizes the proton gradient to synthesize ATP.
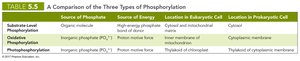
Types of Phosphorylation
Phosphorylation is the process of adding a phosphate group to ADP to form ATP. There are three main types:
Type | Source of Phosphate | Source of Energy | Location in Eukaryotic Cell | Location in Prokaryotic Cell |
|---|---|---|---|---|
Substrate-level | Organic molecule | High-energy phosphate bond of substrate | Cytosol and mitochondrial matrix | Cytosol |
Oxidative | Inorganic phosphate (PO43-) | Proton motive force | Inner membrane of mitochondrion | Cytoplasmic membrane |
Photophosphorylation | Inorganic phosphate (PO43-) | Proton motive force | Thylakoid of chloroplast | Thylakoid or cytoplasmic membrane |
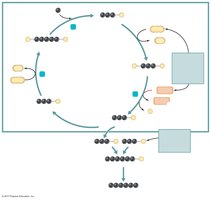
Calvin-Benson Cycle (Photosynthesis)
The Calvin-Benson cycle is the light-independent phase of photosynthesis, fixing carbon dioxide into organic molecules using ATP and NADPH generated by light-dependent reactions.
Three Steps: Fixation of CO2, reduction, regeneration of RuBP.
Key Intermediates: 3-phosphoglyceric acid, glyceraldehyde 3-phosphate (G3P), glucose.
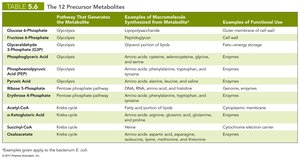
Precursor Metabolites
Precursor metabolites are intermediates in catabolic pathways that serve as building blocks for biosynthesis of macromolecules. The following table lists the 12 key precursor metabolites:
Metabolite | Pathway That Generates | Macromolecule Synthesized | Functional Use |
|---|---|---|---|
Glucose 6-phosphate | Glycolysis | Polysaccharide | Outer membrane of cell wall |
Fructose 6-phosphate | Glycolysis | Peptidoglycan | Cell wall |
Glyceraldehyde 3-phosphate (G3P) | Glycolysis | Glycerol portion of lipids | Fat—energy storage |
Pyruvic acid | Glycolysis | Amino acids, valine, alanine, leucine | Enzymes |
Acetyl-CoA | Krebs cycle | Fatty acid portion of lipids | Membranes |
Succinyl-CoA | Krebs cycle | Porphyrins | Cytochrome membrane |
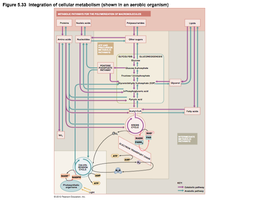
Integration and Regulation of Metabolic Function
Cells regulate metabolism by controlling enzyme synthesis and activity, channel and transport protein production, and feedback inhibition. Eukaryotic cells compartmentalize metabolic pathways within organelles, while prokaryotes rely on cytoplasmic regulation.
Gene expression: Controls amount and timing of enzyme production.
Metabolic expression: Controls activity of enzymes after synthesis.
Feedback inhibition: Prevents overproduction of metabolites.
Amphibolic pathways: Pathways that function in both catabolism and anabolism, regulated by coenzyme specificity.
Additional info: The notes above expand on brief points with academic context, definitions, and examples to ensure completeness and clarity for exam preparation.
