 Back
BackMicrobial Metabolism: Energetics and Catabolism (Chapter 13 Study Notes)
Study Guide - Smart Notes
 Tailored notes based on your materials, expanded with key definitions, examples, and context.
Metabolism: Energetics and Catabolism
Introduction to Metabolism
Metabolism encompasses all chemical reactions that occur within living organisms, divided into two main types: catabolism (breakdown of complex molecules) and anabolism (synthesis of cellular components). Catabolic reactions release energy, while anabolic reactions require energy input.
Catabolism: Breakdown of complex molecules into smaller ones, releasing energy.
Anabolism: Synthesis of cellular components from smaller molecules, requiring energy.
Energy and Entropy in Biological Systems
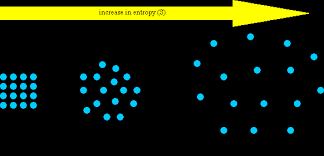
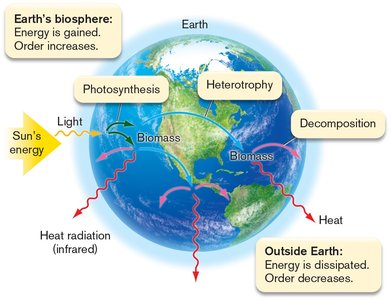
Energy is the capacity to do work, while entropy measures the disorder or randomness in a system. Life maintains order by acquiring energy from the environment and dissipating entropy.
Energy: Required for cellular processes and maintaining order.
Entropy: Tends to increase in isolated systems; cells counteract this by using energy.
Solar energy: Drives photosynthesis and heterotrophy in Earth's biosphere.
Gibbs Free Energy Change (ΔG)
The direction and spontaneity of a reaction are determined by the Gibbs free energy change (ΔG), which depends on changes in enthalpy (ΔH) and entropy (ΔS):
ΔG = ΔH – TΔS
ΔH: Change in enthalpy (heat absorbed or released).
TΔS: Product of temperature and entropy change.
If ΔG < 0, the reaction is spontaneous; if ΔG > 0, the reaction is non-spontaneous.
Prefixes in Microbial Metabolism
Microbes are classified by their sources of carbon, energy, and electrons:
Auto-: CO2 is fixed and assembled into organic molecules.
Hetero-: Preformed organic molecules are acquired and assembled.
Photo-: Light absorption captures energy.
Chemo-: Chemical reactions yield energy.
Lith-: Inorganic molecules donate electrons.
Organo-: Organic molecules donate electrons.
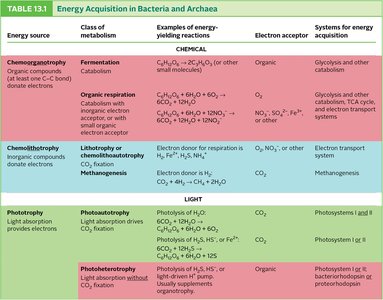
Energy Acquisition in Bacteria and Archaea
Bacteria and archaea utilize diverse strategies for energy acquisition, classified by energy, electron, and carbon sources.
Energy Source | Class of Metabolism | Examples of Energy-Yielding Reactions | Electron Acceptor | Systems for Energy Acquisition |
|---|---|---|---|---|
Chemotrophy | Fermentation, Organic Respiration | Organic compounds (e.g., glucose) | Organic, O2, NO3- | Glycolysis, TCA cycle, Electron transport |
Chemolithotrophy | Lithotrophy, Methanogenesis | Inorganic compounds (e.g., H2, NH4+) | O2, NO3-, CO2 | Electron transport system, Methanogenesis |
Phototrophy | Photoautotrophy, Photoheterotrophy | Light absorption | CO2, Organic | Photosystems I & II, Bacteriorhodopsin |
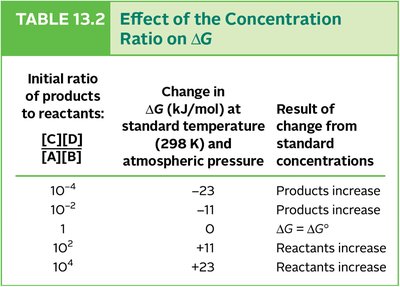
Effect of Concentration Ratio on ΔG
The concentration of reactants and products affects the Gibbs free energy change (ΔG) and the direction of reactions.
Initial Ratio [C][D]/[A][B] | ΔG (kJ/mol) | Result |
|---|---|---|
10-4 | -23 | Products increase |
10-2 | -11 | Products increase |
1 | 0 | ΔG = ΔG° |
102 | +11 | Reactants increase |
104 | +23 | Reactants increase |
Energy Carriers and Electron Transfer
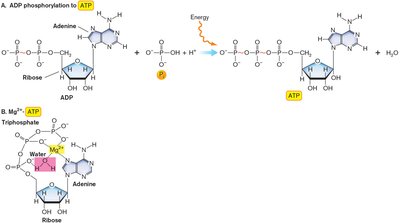
ATP: The Universal Energy Carrier
Adenosine triphosphate (ATP) is the primary energy carrier in cells, consisting of adenine, ribose, and three phosphates. ATP forms a complex with Mg2+ and is essential for cellular metabolism.
ATP hydrolysis releases energy for cellular processes.
ATP can transfer energy by hydrolysis (releasing Pi or PPi) or phosphorylation of organic molecules.
Other nucleotides, such as GTP, also carry energy.
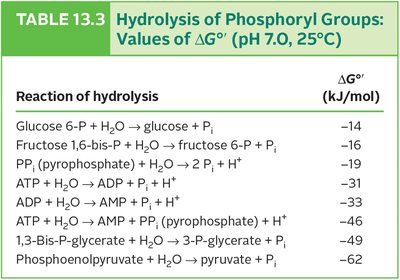
Reaction of Hydrolysis | ΔG°' (kJ/mol) |
|---|---|
Glucose 6-P + H2O → glucose + Pi | -14 |
Fructose 1,6-bis-P + H2O → fructose 6-P + Pi | -16 |
PPi + H2O → 2 Pi + H+ | -19 |
ATP + H2O → ADP + Pi + H+ | -33 |
ADP + H2O → AMP + Pi + H+ | -33 |
ATP + H2O → AMP + PPi + H+ | -46 |
1,3-Bis-P-glycerate + H2O → 3-P-glycerate + Pi | -49 |
Phosphoenolpyruvate + H2O → pyruvate + Pi | -62 |
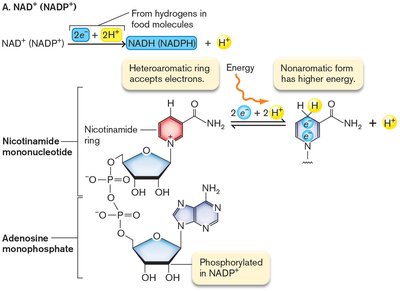
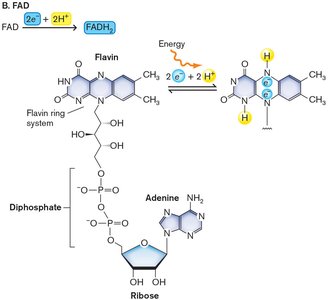
NADH and FADH2: Electron and Energy Carriers
NADH and FADH2 are coenzymes that carry electrons and energy. NADH is the reduced form of NAD+, and FADH2 is the reduced form of FAD. These molecules participate in redox reactions and are essential for cellular respiration.
NAD+ + 2 H+ + 2 e- → NADH + H+ ()
FAD + 2 H+ + 2 e- → FADH2 ()
NADH carries more energy than ATP; FADH2 is a weaker electron donor but releases energy when combined with strong acceptors like O2.
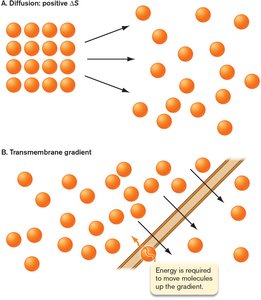
Concentration Gradients and Transport
Concentration Gradients
Cells use concentration gradients to store and utilize energy. Moving substances against their gradient requires energy, while diffusion down a gradient increases entropy.
Transporters in the cell membrane facilitate nutrient uptake.
Entropy favors movement from high to low concentration.
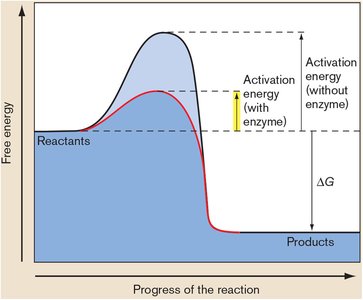
Enzymes and Metabolic Reactions
Enzyme Catalysis
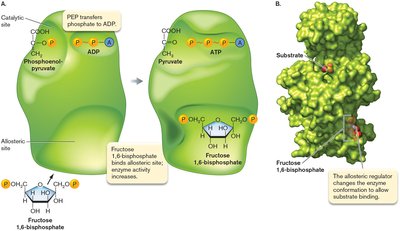
Enzymes are biological catalysts that lower the activation energy (Ea) of reactions, increasing the rate of conversion from reactants to products. Enzymes may have allosteric sites for regulation.
Enzymes couple energy-yielding and energy-requiring reactions.
Allosteric regulation allows control of enzyme activity.
Catabolism: The Microbial Buffet
Substrate Diversity in Microbial Catabolism
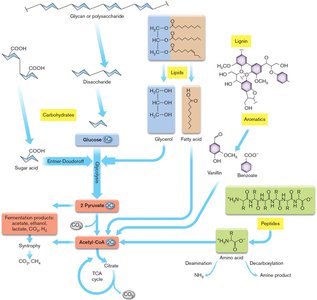
Microbes can catabolize a wide range of substrates, including polysaccharides, lipids, amino acids, and aromatic compounds. These substrates are broken down into central intermediates such as pyruvate and acetyl-CoA.
Polysaccharides → monosaccharides → pyruvate
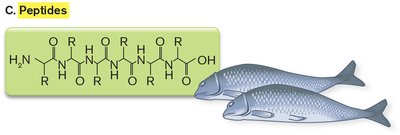
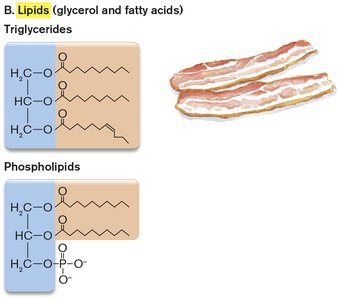
Lipids and amino acids → glycerol, acetate, metabolic intermediates
Aromatic compounds → acetate via catechol pathway
Catabolic Pathways
Three main catabolic pathways exist in microbes:
Fermentation: Partial breakdown of organic food without net electron transfer to an inorganic terminal electron acceptor.
Respiration: Complete breakdown of organic molecules with electron transfer to a terminal electron acceptor (e.g., O2).
Photoheterotrophy: Catabolism with energy boost from light.
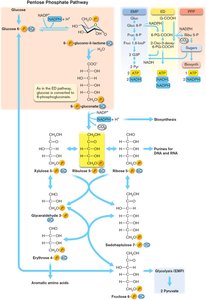
Glucose Catabolism: Pathways to Pyruvate
Three Main Pathways
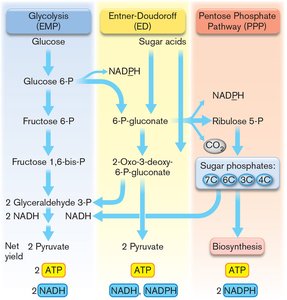
Bacteria and archaea use three main routes to catabolize glucose:
Glycolysis (EMP pathway): Most common, yields 2 ATP and 2 NADH.
Entner-Doudoroff (ED) pathway: Yields 1 ATP, 1 NADH, and 1 NADPH.
Pentose phosphate pathway (PPP): Yields 1 ATP and 2 NADPH.
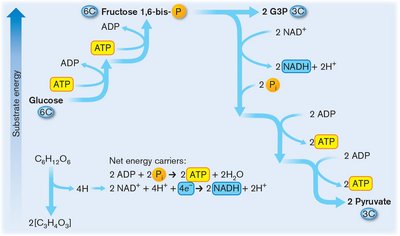
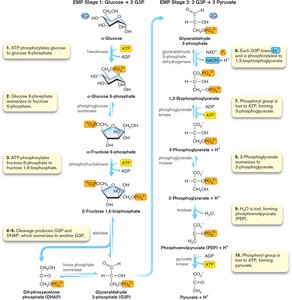
EMP Pathway (Glycolysis)
The EMP pathway involves ten reactions divided into two stages: glucose activation and energy-yielding.
Glucose activation: Phosphorylation to fructose-1,6-bisphosphate (2 ATP used).
Energy-yielding: Conversion to pyruvate, production of 2 NADH and 4 ATP (net 2 ATP).
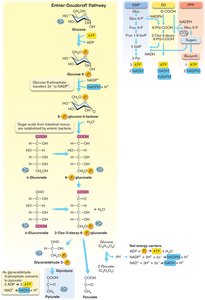
Entner-Doudoroff Pathway
The ED pathway is found in many prokaryotes and produces fewer ATP than EMP. It is important in gut flora and certain fermentative bacteria.
Glucose is phosphorylated, dehydrogenated, and cleaved to pyruvate and glyceraldehyde-3-P.
Produces 1 ATP, 1 NADH, and 1 NADPH.
Pentose Phosphate Pathway (PPP)
The PPP forms 6-phosphogluconate and ribulose-5-phosphate, producing sugars for biosynthesis and NADPH for anabolic reactions.
Produces 1 ATP and 2 NADPH.
Key for biosynthesis of nucleotides and aromatic amino acids.
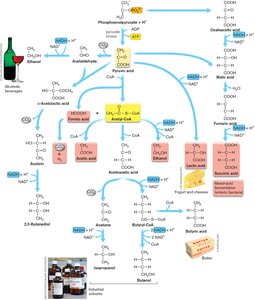
Fermentation and Its Applications
Fermentation Pathways
Fermentation completes catabolism without an electron transport system. Hydrogens from NADH are transferred back onto pyruvate products, forming partially oxidized compounds.
Homolactic fermentation: Produces lactic acid.
Ethanolic fermentation: Produces ethanol and CO2.
Heterolactic fermentation: Produces lactic acid, ethanol, and CO2.
Mixed-acid fermentation: Produces acetate, formate, lactate, succinate, ethanol, H2, and CO2.
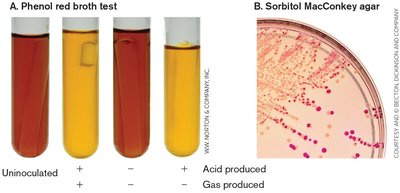
Industrial and Clinical Applications
Fermentation products are used in industry (solvents, fuels) and clinical diagnostics (microbial identification via biochemical tests).
Phenol red broth test detects acid production.
Sorbitol MacConkey agar differentiates bacteria based on fermentation.
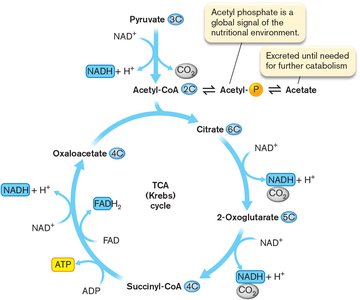
Pyruvate, Acetyl-CoA, and the TCA Cycle
Pyruvate to Acetyl-CoA
Pyruvate is converted to acetyl-CoA by the pyruvate dehydrogenase complex (PDC), linking glycolysis to the TCA cycle.
Pyruvate + NAD+ + CoA → Acetyl-CoA + CO2 + NADH + H+
PDC is regulated by carbon availability and oxygen levels.
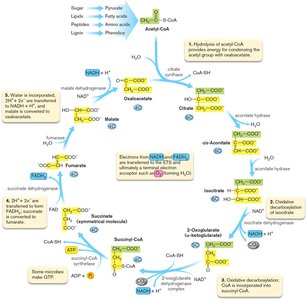
The Tricarboxylic Acid (TCA) Cycle
The TCA cycle (Krebs/citric acid cycle) oxidizes acetyl-CoA to CO2 and transfers electrons to NADH and FADH2.
Occurs in cytoplasm (prokaryotes) or mitochondria (eukaryotes).
Acetyl-CoA condenses with oxaloacetate to form citrate.
Each pyruvate yields 3 CO2, 4 NADH, 1 FADH2, and 1 ATP (or GTP).
Oxidative Phosphorylation
After the TCA cycle, electrons from NADH and FADH2 are transferred to a terminal electron acceptor via the electron transport chain, generating ATP.
The Glyoxylate Bypass
When glucose is absent, cells use the glyoxylate bypass to catabolize acetate or fatty acids, allowing survival in nutrient-limited environments.
Pathogen Mycobacterium tuberculosis uses this pathway to persist in macrophages.
TCA Cycle in Amino Acid Biosynthesis
The TCA cycle also provides intermediates for amino acid and nucleotide biosynthesis.
α-ketoglutarate and oxaloacetate are precursors for amino acids.
Some bacteria lack the TCA cycle and rely on host-derived amino acids.
The Gut Microbiome and Catabolism
Microbiome Diversity and Niche Adaptation
The gut microbiome enables hosts to digest diverse substrates, such as porphyrans in seaweed. Horizontal gene transfer between marine and gut microbes allows adaptation to new diets.
Enzymes like porphyranase are acquired by gut bacteria.
Microbial catabolism produces neurotransmitters (dopamine, serotonin, GABA).
Aromatic Catabolism and Syntrophy
Aromatic Compound Breakdown
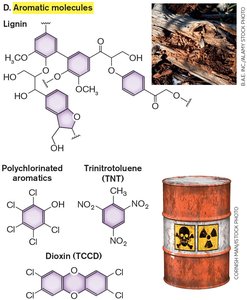
The TCA cycle is central to the breakdown of aromatic compounds (e.g., lignin, benzoate). Microbes recycle these substances and degrade pollutants.
Benzoate is catabolized aerobically to catechol, then to TCA intermediates.
Anaerobic degradation involves reductive pathways.
Syntrophy in Microbial Communities
Syntrophy couples metabolism between organisms, enabling breakdown of stable compounds and energy generation in challenging environments.
Important for bioremediation and environmental cleanup.
Chapter Summary
Energy enables cells to build ordered structures.
Direction of reactions depends on stability, reactant concentrations, and environmental conditions.
Energy carriers include ATP, NADH, and FADH2.
Enzymes catalyze reactions by lowering activation energy.
Three main catabolic pathways: fermentation, respiration, photoheterotrophy.
Prokaryotes catabolize sugars, lipids, aromatics.
Glucose catabolism: EMP (2 ATP, 2 NADH), ED (1 ATP, 1 NADH, 1 NADPH), PPP (1 ATP, 2 NADPH).
Fermentation completes catabolism without electron transport chain.
Gut microbial catabolism benefits the host.
Aromatic catabolism involves syntrophy and environmental adaptation.
