 Back
BackMicrobial Metabolism: Structure, Function, and Clinical Relevance
Study Guide - Smart Notes
 Tailored notes based on your materials, expanded with key definitions, examples, and context.
Microbial Metabolism
Defining Metabolism
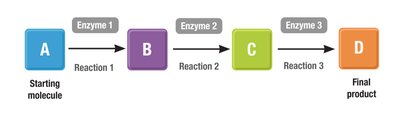
Metabolism encompasses all chemical reactions that organisms use to break down substances to release energy and to build new substances using that energy. These reactions are organized into metabolic pathways, which are sequences of enzymatically catalyzed steps leading from a starting molecule to an end product.
Metabolic Pathways: Series of reactions where intermediates are transformed stepwise by specific enzymes.
Key Point: Each step is catalyzed by a unique enzyme, ensuring specificity and regulation.
Example: Glycolysis, Krebs cycle, and fermentation are metabolic pathways.
Categories of Metabolic Pathways
Metabolic pathways are classified into three main types based on their function:
Catabolic Pathways: Break down complex molecules into simpler ones, releasing energy (usually exergonic).
Anabolic Pathways: Build complex molecules from simpler ones, requiring energy input (usually endergonic).
Amphibolic Pathways: Serve both catabolic and anabolic functions, depending on cellular needs.
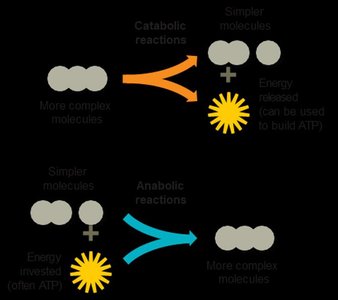
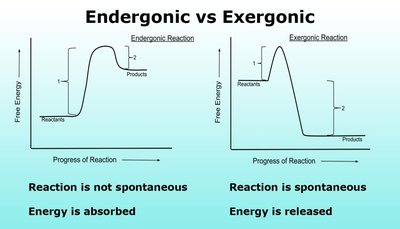
Catabolic vs. Anabolic Reactions
Catabolic reactions are hydrolytic and exergonic, breaking down molecules and releasing energy. Anabolic reactions, also known as biosynthetic reactions, involve dehydration synthesis and are endergonic, requiring energy input.
Catabolism: Example: Breakdown of glucose into CO2 and H2O.
Anabolism: Example: Synthesis of proteins from amino acids.
Energy Profile: Catabolic reactions release energy; anabolic reactions absorb energy.
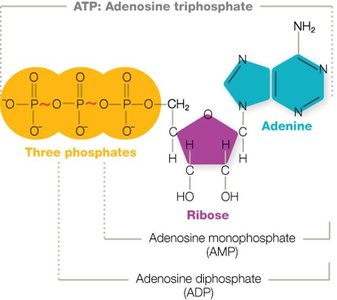
ATP: The Energy Currency of the Cell
ATP (adenosine triphosphate) is the primary energy carrier in cells. It is produced by catabolic reactions and used to power anabolic reactions. ATP consists of adenine, ribose, and three phosphate groups.
ATP Structure: Three phosphates, ribose sugar, adenine base.
Energy Release: Hydrolysis of the terminal phosphate releases energy.
ATP Production: Fats yield more ATP than carbohydrates due to higher energy content.
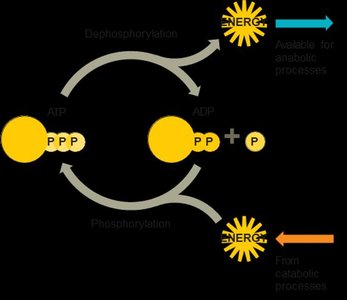
ATP–ADP Cycling
Cells continuously cycle between ATP and ADP. Dephosphorylation of ATP releases energy and forms ADP; phosphorylation of ADP regenerates ATP.
Dephosphorylation: ATP → ADP + Pi + energy
Phosphorylation: ADP + Pi + energy → ATP
Efficiency: Cycling is fast, energy-efficient, and easily regulated.
Enzymes and Metabolic Regulation
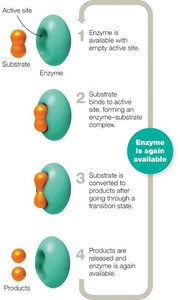
Enzyme Structure and Function
Enzymes are protein catalysts that accelerate chemical reactions by lowering activation energy. They are highly specific, acting on particular substrates to produce specific products.
Active Site: Region where substrate binds and reaction occurs.
Induced Fit Model: Enzyme molds to substrate, stabilizing transition state.
Enzyme-Substrate Complex: Temporary association that facilitates reaction.
Enzyme Classification
Enzymes are classified based on the type of reaction they catalyze. Their names often end in "-ase" and reflect their substrate or reaction type.
Oxidoreductase: Catalyzes oxidation-reduction reactions.
Transferase: Transfers functional groups.
Hydrolase: Catalyzes hydrolysis reactions.
Lyase: Removes groups without hydrolysis.
Isomerase: Rearranges atoms within molecules.
Ligase: Joins two molecules, often using energy.
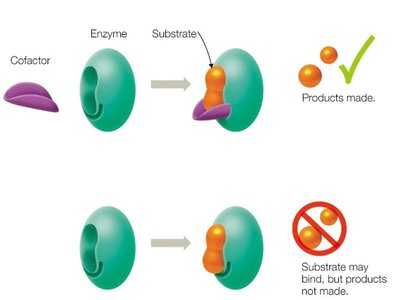
Enzyme Cofactors and Coenzymes
Some enzymes require non-protein cofactors for activity. Cofactors can be inorganic ions (e.g., iron, zinc) or organic molecules (coenzymes, often vitamins).
Apoenzyme: Inactive enzyme without cofactor.
Holoenzyme: Active enzyme with cofactor.
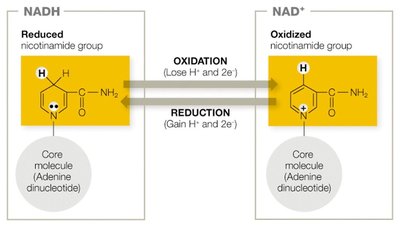
Coenzymes: NAD+, FAD, CoA, FMN, NADP+ act as electron carriers.
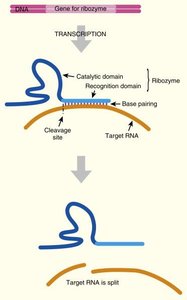
Ribozymes
Ribozymes are catalytic RNA molecules that act on other RNA, playing roles in RNA processing and gene regulation.
Factors Affecting Enzyme Activity
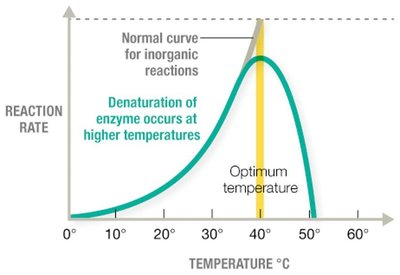
Enzyme activity is influenced by temperature, pH, substrate concentration, phosphorylation state, and inhibitors.
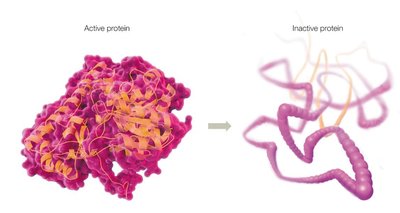
Temperature: Optimal temperature maximizes activity; high temperatures cause denaturation.
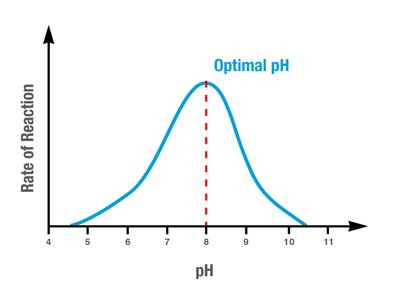
pH: Optimal pH maintains enzyme structure; extremes cause denaturation.
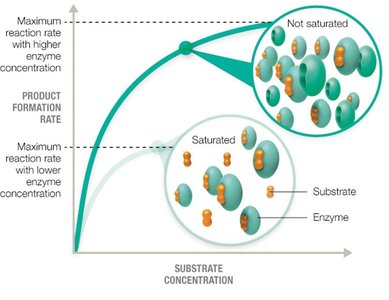
Concentration: Saturation occurs when all active sites are occupied.
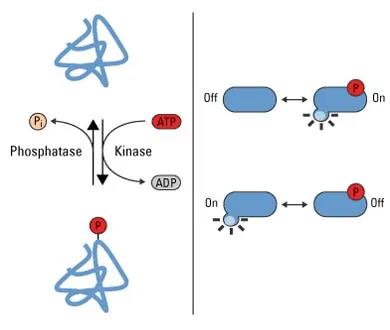
Phosphorylation: Kinases add phosphate groups; phosphatases remove them, altering activity.
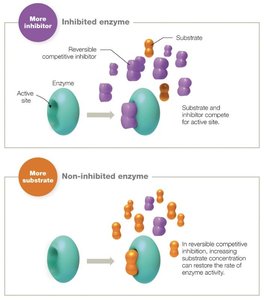
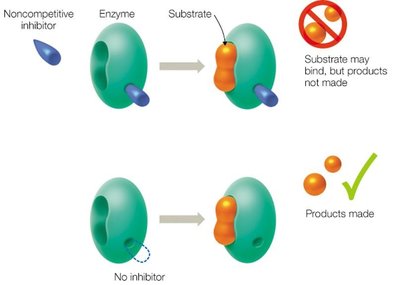
Inhibitors: Competitive inhibitors compete for active site; noncompetitive inhibitors bind elsewhere.
Energy Production and Redox Reactions
Redox Reactions
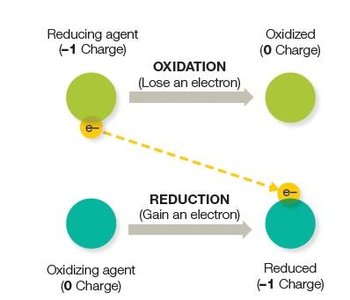
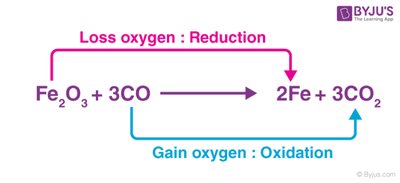
Redox reactions involve the transfer of electrons between molecules, fueling the recharging of ADP to ATP. Oxidation is the loss of electrons; reduction is the gain of electrons.
Oxidizing Agent: Accepts electrons.
Reducing Agent: Donates electrons.
Biological Example: NAD+ is reduced to NADH; FAD is reduced to FADH2.
Mechanisms of ATP Production
Cells recharge ADP to ATP via three mechanisms:
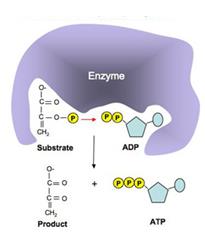
Substrate-Level Phosphorylation: Direct transfer of phosphate from a substrate to ADP.
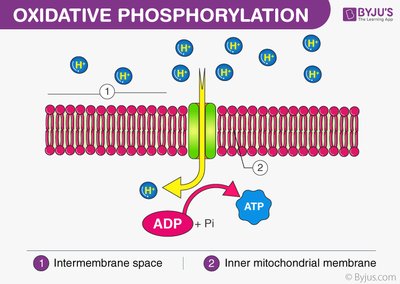
Oxidative Phosphorylation: Uses electron transport chains powered by nutrients.
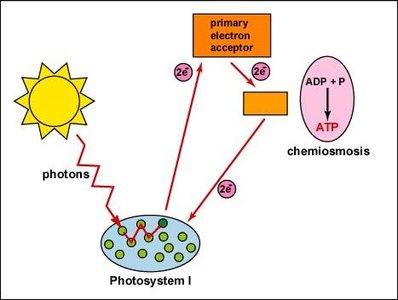
Photophosphorylation: Uses electron transport chains powered by light energy (photosynthetic cells only).
Mechanism | How ATP is made | Electron Transport Chain Used? | Used in | Cell Types |
|---|---|---|---|---|
Substrate-Level Phosphorylation | Direct transfer from intermediate to ADP | No | Glycolysis, Krebs cycle, fermentation | Prokaryotic & eukaryotic |
Oxidative Phosphorylation | Electron transport chains powered by nutrients | Yes | Aerobic & anaerobic respiration | Prokaryotic & eukaryotic |
Photophosphorylation | Electron transport chains powered by solar energy | Yes | Photosynthesis | Photosynthetic cells |
Carbohydrate Catabolism
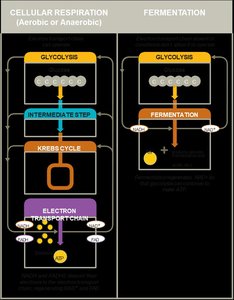
Cellular Respiration and Fermentation
Cells extract energy from carbohydrates primarily through cellular respiration and fermentation. Cellular respiration includes glycolysis, an intermediate step, Krebs cycle, and electron transport chain.
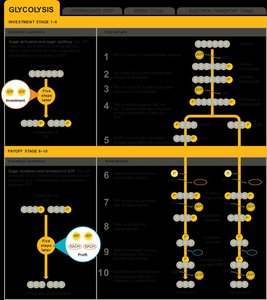
Glycolysis: Ten-step pathway converting glucose to pyruvic acid, yielding ATP and NADH.
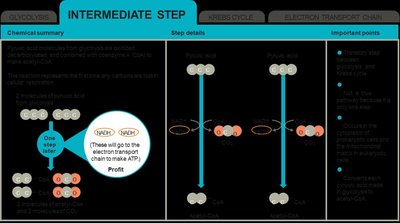
Intermediate Step: Converts pyruvic acid to acetyl-CoA, releasing CO2.
Krebs Cycle: Series of redox and decarboxylation reactions, producing ATP, NADH, FADH2, and CO2.
Electron Transport Chain: Transfers electrons to final acceptor, driving ATP synthesis.
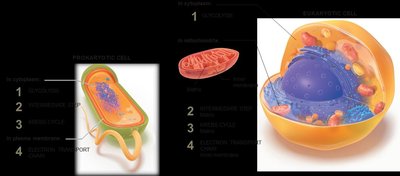
Electron Transport Chains and Chemiosmosis
Electron transport chains use membrane-associated carriers to transfer electrons, releasing energy to pump protons and create a proton motive force. ATP synthase uses this force to synthesize ATP.
Location: Inner mitochondrial membrane (eukaryotes), plasma membrane (prokaryotes).
Final Electron Acceptors: Oxygen (aerobic), inorganic molecules (anaerobic).
ATP Yield: Aerobic respiration yields up to 38 ATP per glucose in prokaryotes.
Alternative Pathways for Sugar Catabolism
Cells may use the pentose phosphate pathway or Entner-Doudoroff pathway to metabolize carbohydrates, producing NADPH and other intermediates for biosynthesis.
Anaerobic Respiration vs. Fermentation
Anaerobic respiration uses a respiratory chain with inorganic final electron acceptors, while fermentation does not use a respiratory chain and relies on organic molecules as electron acceptors.
Process | Oxygen Needed? | Final Electron Acceptor | ATP Produced | Electron Transport Chain? |
|---|---|---|---|---|
Fermentation | No | Organic molecule (e.g., pyruvic acid) | 2–3 ATP | No |
Aerobic Respiration | Yes | Oxygen | Up to 38 ATP | Yes |
Anaerobic Respiration | No | Inorganic molecule (e.g., nitrate, sulfate) | <38 ATP | Yes |
Types of Fermentation
Fermentation pathways are named for their end products and vary by organism.
Lactic Acid Fermentation: Homolactic (produces lactic acid), heterolactic (produces lactic acid, ethanol, CO2).
Alcohol Fermentation: Produces ethanol and CO2.
Mixed Acid Fermentation: Produces various acids and gases.
Butanediol Fermentation: Produces neutral end products.
Catabolism of Other Macromolecules
Lipid, Protein, and Nucleic Acid Catabolism
Cells break down macromolecules using exoenzymes, then funnel smaller molecules into catabolic pathways.
Lipases: Break down lipids into glycerol and fatty acids.
Proteases/Peptidases: Break down proteins into peptides and amino acids.
Nucleases: Break down nucleic acids into nucleotides.
Anabolic Pathways and Biosynthesis
Polysaccharide, Lipid, and Amino Acid Biosynthesis
Anabolic pathways use ATP and reducing power (NADPH) to build biological molecules. Gluconeogenesis builds glucose from nonsugar precursors; glycogenesis assembles glycogen; lipid biosynthesis links acetyl-CoA molecules.
Amino Acid and Nucleotide Biosynthesis
Cells synthesize nonessential amino acids by amination and recycle nucleotides for nucleic acid synthesis. Purines and pyrimidines are made de novo or recycled.
Amphibolic Pathways and Metabolic Regulation
Amphibolic Pathways
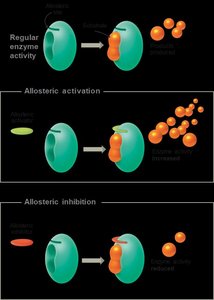
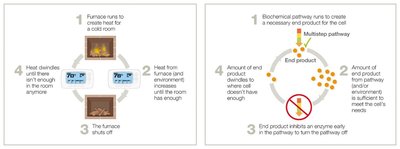
Amphibolic pathways function in both catabolism and anabolism, allowing cells to balance energy production and biosynthesis. Regulation occurs via cofactors, enzyme activity, and feedback inhibition.
Catabolic Pathways | Anabolic Pathways | All Metabolic Pathways |
|---|---|---|
Breakdown of molecules | Building molecules | Tightly regulated |
Release energy | Consume energy | Necessary for cell survival |
Rely on NAD+ | Rely on NADPH | Require enzymes |
Example: cellular respiration | Example: lipid biosynthesis |
Microbial Nutrition and Identification
Autotrophs vs. Heterotrophs
Autotrophs fix carbon from inorganic sources; heterotrophs require organic carbon. Phototrophs use light energy; chemotrophs use chemical energy; mixotrophs switch between modes.
Biochemical Tests for Microbial Identification
Metabolic profiles serve as biochemical fingerprints for identifying microbes. Tests detect metabolic end products, intermediates, or enzymes.
Amino Acid Catabolism Tests: Detect deaminases and decarboxylases (e.g., phenylalanine deaminase, ornithine decarboxylase).
Fermentation Tests: Detect acid and gas production using pH indicators and Durham tubes.
Methyl Red/Voges-Proskauer (MRVP) Test: Distinguishes mixed acid and butanediol fermentation.
Oxidase Test: Detects cytochrome c oxidase.
Catalase Test: Detects catalase enzyme (breaks down hydrogen peroxide).
Clinical Application: Metabolic Disorders and Microbial Pathogenesis
Case Study: Diabetic Ketoacidosis and Clostridium perfringens Infection
Metabolic imbalances, such as diabetic ketoacidosis, can increase susceptibility to infections by anaerobic bacteria. Biochemical tests help identify pathogens and guide treatment.
Key Point: High blood glucose and ketoacidosis can coexist due to impaired glucose uptake.
Fat Metabolism: Preferred over protein to preserve cellular function.
Low pH: Dangerous due to enzyme denaturation and impaired cellular processes.
Diabetic Risk: Poor circulation and high glucose favor anaerobic infections.
Biochemical Tests: Clostridium perfringens is negative for oxidase and catalase tests.
