 Back
BackMicrobial Nutrition and Growth: Bacterial Enumeration, Growth Curves, and Serial Dilution
Study Guide - Smart Notes
 Tailored notes based on your materials, expanded with key definitions, examples, and context.
Microbial Nutrition and Growth
Phases of the Standard Bacterial Growth Curve
The standard growth curve describes the population dynamics of bacteria under laboratory conditions. It is divided into distinct phases based on the rates of cell division and cell death.
Lag Phase: Bacteria acclimatize to a new environment; no cell division or death occurs. Cells are metabolically active, preparing for growth.
Log (Exponential) Phase: Cells divide at an exponential rate, doubling the population each generation. This phase is preferred for experiments due to uniform growth.
Stationary Phase: Growth rate equals death rate; population size remains constant. Resource depletion and waste accumulation limit further growth.
Death Phase: Death rate exceeds growth rate; population size declines as resources are exhausted and toxic byproducts accumulate.
Example: In laboratory cultures, the log phase is ideal for studying bacterial metabolism and genetics due to active cell division.
Environmental Factors Affecting Bacterial Growth
Bacterial growth is influenced by environmental conditions and the generation time, which is the period required for a cell to divide.
Generation Time: The time from cell formation to division. Some bacteria divide every 15-20 minutes under optimal conditions.
Binary Fission: Bacteria reproduce by splitting into two new cells, leading to rapid population increases.
Colony Formation: Under ideal conditions, bacterial colonies become visible in a short time due to exponential growth.
Enumeration: Calculating Dilution Factors
Enumeration is the process of quantifying the number of cells in a sample. Serial dilution is used to obtain countable colonies for accurate estimation.
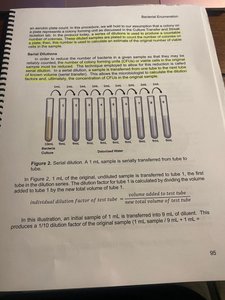
Serial Dilution: A sample is diluted stepwise to reduce cell concentration. Each dilution is transferred to a new tube with a known volume of diluent.
Dilution Factor Formula: Example: Adding 1 mL sample to 9 mL diluent yields a 1/10 dilution:
Purpose of Serial Dilutions and Spread Plates
Serial dilutions and spread plating are essential for reducing bacterial concentration and enabling accurate colony counts.
Serial Dilution: Reduces the number of colony forming units (CFU) in a sample to a countable level.
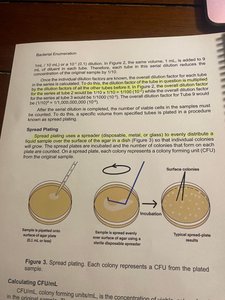
Spread Plating: Uses a spreader to evenly distribute a diluted sample over an agar plate, allowing individual colonies to grow.
Incubation: Plates are incubated, and colonies are counted to estimate the original cell concentration.
Enumeration of CFU/mL Using Serial Dilution and Spread Plating
CFU/mL (colony forming units per milliliter) is calculated by counting colonies on plates and accounting for dilution factors.
CFU Calculation Formula:
Example Table: Colony counts from serial dilution and spread plating.
Plate Dilution | Colony Count |
|---|---|
10-1 | TNTC |
10-2 | TNTC |
10-3 | TNTC |
10-4 | 234 |
10-5 | 19 |
10-6 | 5 |
Example Calculation: If 234 colonies are counted on a plate from a 10-4 dilution with 0.1 mL plated:
CFU/mL
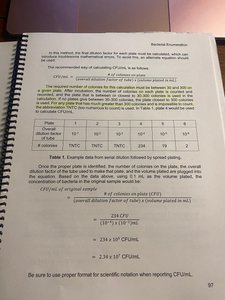
Additional info: Proper scientific notation should be used when reporting CFU/mL. TNTC stands for "too numerous to count." Spread plating ensures colonies are well separated for accurate enumeration.
