 Back
BackMicrobiology Lab Practical Study Guide: Step-by-Step Guidance
Study Guide - Smart Notes
 Tailored notes based on your materials, expanded with key definitions, examples, and context.
Q1. What type of epidemic is represented by Plot A? What type of epidemic is represented by Plot B?
Background
Topic: Epidemiology – Types of Epidemics
This question tests your understanding of how to distinguish between different types of epidemic curves, specifically common source and propagated (host-to-host) epidemics, based on their graphical representation.
Key Terms and Concepts:
Common Source Epidemic: An outbreak resulting from a group of people being exposed to a common infectious agent or toxin from the same source (e.g., contaminated food or water) over a short period.
Propagated (Host-to-Host) Epidemic: An outbreak that spreads from person to person, often resulting in a slower rise and fall in cases as the infection moves through the population.
Step-by-Step Guidance
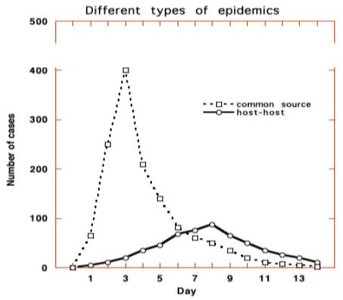
Examine the shape of each epidemic curve in the provided graph. Notice the differences in how quickly the number of cases rises and falls for each plot.
For Plot A (dotted line with squares), observe whether the cases increase rapidly to a peak and then decline quickly, or if the increase and decrease are more gradual.
For Plot B (solid line with circles), look for a slower, more progressive rise in cases, followed by a gradual decline, which may indicate person-to-person transmission.
Recall that a sharp, single peak is characteristic of a common source epidemic, while a more spread-out curve with multiple peaks or a slower rise is typical of a propagated epidemic.
Match each plot to the correct epidemic type based on these observations, but do not write the final answer yet.
Try solving on your own before revealing the answer!
Final Answer:
Plot A (dotted line with squares) represents a common source epidemic, as shown by the rapid rise and fall in cases. Plot B (solid line with circles) represents a propagated (host-to-host) epidemic, indicated by the slower, progressive increase and decrease in cases.
This distinction is important in epidemiology for identifying the source and controlling the spread of infectious diseases.
