 Back
BackVolumetric Micropipette Use and Spectrophotometry in Biochemical Analysis
Study Guide - Smart Notes
 Tailored notes based on your materials, expanded with key definitions, examples, and context.
Volumetric Micropipettes and Their Calibration
Principles and Correct Use of Micropipettes
Micropipettes are essential tools in biochemical and microbiological laboratories for accurately measuring and delivering small volumes of liquid, typically in the range of 0.5–1000 μL. Proper technique and care are crucial to ensure precision and avoid contamination or damage.
Selection: Choose the appropriate pipette and disposable tip for the desired volume.
Volume Setting: Adjust the digital selector to the required volume, ensuring not to exceed the specified range.
Pipetting Technique: Depress the operating button to the first stop, immerse the tip just below the fluid surface, and release smoothly. Deliver the liquid by pressing to the second stop.
Tip Care: Tips are disposable but should be reused for repetitive pipetting of the same solution to conserve supplies.
Example: Pipetting 1000 μL of water from a beaker to a microcentrifuge tube, following the demonstrator's guidance.
Calibration of Micropipettes
Calibration ensures the accuracy of delivered volumes. The process involves weighing the transferred water and calculating the actual volume based on the mass (assuming water density = 1 g/mL).
Procedure: Use a balance to measure the mass of water delivered at set volumes (e.g., 80 μL and 150 μL).
Calculation: Average the measured volumes and determine percent deviation from the set volume.
Formula: Percent deviation =
Introduction to Spectrophotometry
Principles of Spectrophotometry and Colorimetry
Spectrophotometry is a quantitative technique used to measure the absorbance of light by a solution, which correlates to the concentration of the analyte. Colorimetry refers specifically to measurements in the visible spectrum (400–780 nm), while spectrophotometers can also measure ultraviolet and infrared regions.
Transmittance (T): The ratio of emergent light intensity (I) to incident light intensity (I0).
Absorbance (A): Defined as ; it is linearly related to concentration.
Beer-Lambert Law: The absorbance of a solution is proportional to its concentration and path length:
ε (Molar absorptivity): A constant specific to the substance and wavelength, typically in units of M-1cm-1.
l: Path length (cm)
c: Concentration (M)
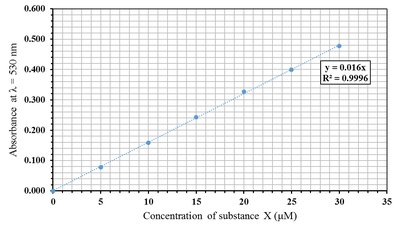
Example: If an unknown sample has an absorbance of 0.347, ε = 0.016 μM-1cm-1, and l = 1 cm:
Quantitative Analysis Using Standard Curves
Standard curves are constructed by measuring the absorbance of solutions with known concentrations. The slope of the curve gives the absorptivity, allowing calculation of unknown concentrations.
Preparation: Prepare standards and measure their absorbance at the wavelength of maximum absorbance (λmax).
Plotting: Absorbance (y-axis) vs. concentration (x-axis) yields a straight line through the origin.
Calculation: Use the slope (ε) to determine unknown concentrations.
Note: Unknown sample absorbance must fall within the standard curve range for reliable results. Dilute samples if necessary and account for dilution in calculations.
Use of Solvent Blanks
A solvent blank contains all components except the analyte and is used to set the spectrophotometer to zero absorbance. This corrects for any absorbance from other reagents.
Importance: Ensures accurate measurement by eliminating background absorbance.
Colourigenic Assays
Principles of Colourigenic Reactions
Some compounds do not absorb light at suitable wavelengths or may overlap with other substances. Colourigenic assays involve chemical reactions that produce a new chromophore, which is then measured spectrophotometrically.
Consistency: Standards and unknowns must be prepared identically to ensure reliable color yield.
Reagent Blank: Prepared in the same way as samples to account for background absorbance.
Protein Analysis: Biuret Assay
The biuret assay is a colorimetric method for protein quantification. It relies on the formation of a colored complex between copper ions and peptide bonds in alkaline conditions.
Advantages: Minimally affected by protein composition; suitable for serum protein analysis.
Procedure: Prepare standards with known protein amounts, add biuret reagent, incubate, and measure absorbance at 540 nm.
Calculation: Use the standard curve to estimate protein concentration in unknown samples, accounting for dilution factors.
Example: If the unknown sample is diluted 10-fold, multiply the calculated concentration by 10 to obtain the original concentration.
Isoelectric Points of Proteins
Determination of Isoelectric Point (pI)
The isoelectric point is the pH at which a protein carries equal positive and negative charges, resulting in minimal solubility and precipitation. The pI can be determined by observing precipitation in solutions of varying pH.
Procedure: Prepare tubes with different ratios of acetic acid and sodium acetate, add protein, and observe turbidity/precipitation.
Scoring: Rate precipitation from 0 to 3; agitate tubes to ensure accurate observation.
pH Measurement: Use pH test strips and calculate theoretical pH based on buffer concentrations (pKa of acetic acid = 4.76).
Identification: Match observed pI to known values for proteins (e.g., Casein: 4.7, Lactoglobulin: 5.1).
Formula: Theoretical pH calculation for buffer mixtures:
Example: If precipitation is highest at pH ≈ 4.7, the protein is likely casein.
Summary Table: Standard Curve Preparation for Bromophenol Blue (BPB)
The following table summarizes the setup for BPB standard curve analysis:
Sample | Volume of 60 μM BPB (mL) | Volume H2O (mL) | Total Volume (mL) | Final Conc. (μM) |
|---|---|---|---|---|
Blank | 0 | 3.0 | 3.0 | 0 |
Std 1 | 0.2 | 2.8 | 3.0 | 4 |
Std 2 | 0.4 | 2.6 | 3.0 | 8 |
Std 3 | 0.6 | 2.4 | 3.0 | 12 |
Std 4 | 0.8 | 2.2 | 3.0 | 16 |
Std 5 | 1.0 | 2.0 | 3.0 | 20 |
Additional info: Standard curve tables are essential for quantitative spectrophotometric analysis, allowing for accurate determination of unknown concentrations.
