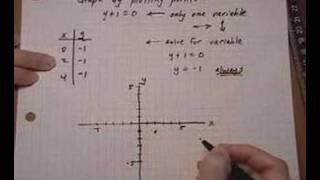
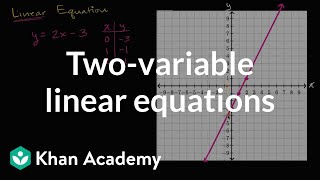
04:29Graphing solutions to two-variable linear equations example 1 | Algebra I | Khan AcademyKhan Academy391views
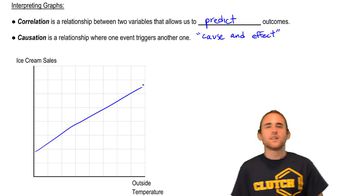
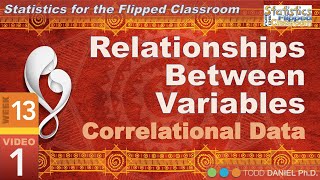
05:44A Gentle Introduction to Correlation – Relationships Between Variables (13-1)Research By Design409views
01:43Correlation Does Not Imply Causation: A One Minute Perspective on Correlation vs. CausationOne Minute Economics361views
01:30Correlation vs. Causality: The Debunked Link Between Ice Cream and Polio | FreakonomicsFreakonomics Radio Network397views
01:43Correlation Does Not Imply Causation: A One Minute Perspective on Correlation vs. CausationOne Minute Economics371views
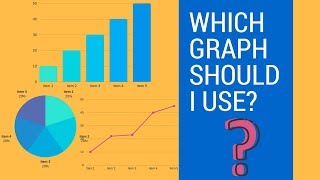
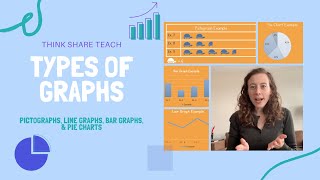
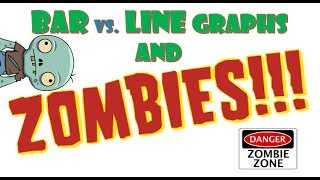
06:25INTERACTIVE: Determine the type of graph to make from ZOMBIE data! Bar vs. Line247 Science348views
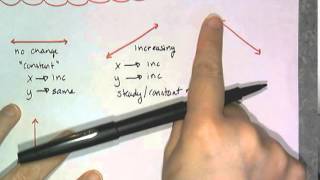
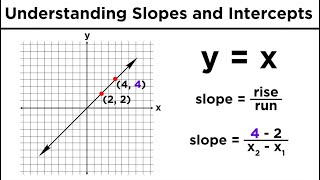
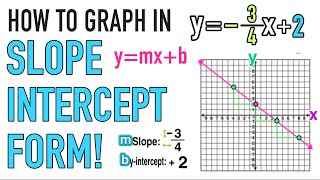
06:52Graphing Lines in Algebra: Understanding Slopes and Y-InterceptsProfessor Dave Explains376views1rank
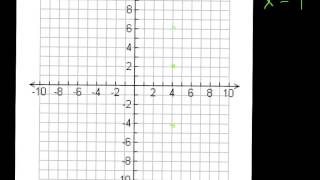
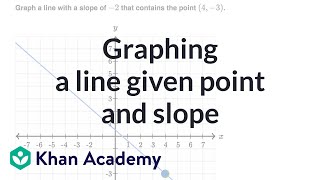
02:11Graphing a line given point and slope | Linear equations & graphs | Algebra I | Khan AcademyKhan Academy334views
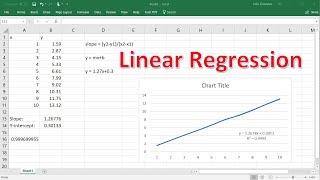
05:53Excel Basics - Linear Regression - Finding Slope & Y InterceptThe Organic Chemistry Tutor352views
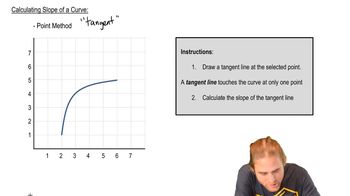
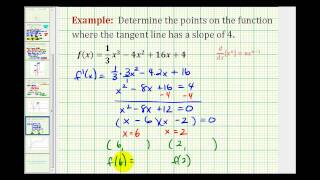
04:38Ex: Determine the Points on a Function When the Tangents Lines Have a Given SlopeMathispower4u336views
04:58How to recognize relative and absolute maxima and minima | Functions | Algebra I | Khan AcademyKhan Academy597views
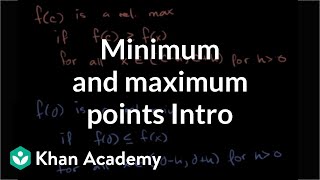
05:30Introduction to minimum and maximum points | Functions | Algebra I | Khan AcademyKhan Academy353views
05:54Graphing Algebraic Functions: Domain and Range, Maxima and MinimaProfessor Dave Explains365views

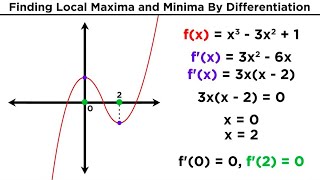
 04:34
04:34