Skip to main content
Microeconomics
My Course
Learn
Exam Prep
AI Tutor
Study Guides
Flashcards
Explore
Try the app
My Course
Learn
Exam Prep
AI Tutor
Study Guides
Flashcards
Explore
Try the app
Back
Budget Constraint definitions
You can tap to flip the card.
Budget Constraint
You can tap to flip the card.
👆
Budget Constraint
A graphical representation showing the combinations of goods a consumer can afford given income and prices.
Track progress
Control buttons has been changed to "navigation" mode.
1/15
Related flashcards
Related practice
Recommended videos
Budget Constraint quiz #1
Budget Constraint
10 Terms
Budget Constraint
18. Consumer Choice and Behavioral Economics
8 problems
Topic
Indifference Curves
18. Consumer Choice and Behavioral Economics
10 problems
Topic
18. Consumer Choice and Behavioral Economics
5 topics
14 problems
Chapter
Guided course
08:41
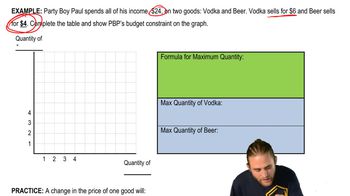
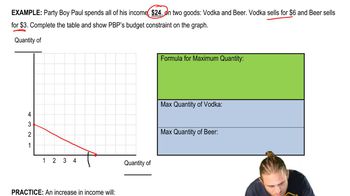
Budget Constraint (Budget Line)
3375
views
50
rank
Guided course
03:50
Budget Constraint:Change in Price of a Good
1868
views
15
rank
Guided course
03:44
Budget Constraint:Change in Income
1844
views
25
rank
Terms in this set (15)
Hide definitions
Budget Constraint
A graphical representation showing the combinations of goods a consumer can afford given income and prices.
Income
The fixed amount of money available for spending on goods after other expenses are paid.
Disposable Income
Funds left for purchasing goods after all other obligations and expenses are settled.
Price
The monetary value assigned to a unit of a good, determining how much can be purchased with available funds.
Maximum Quantity
The highest number of units of a good that can be bought if all income is spent on that good.
Budget Line
A straight line on a graph connecting points representing maximum affordable quantities of two goods.
Affordable Region
The area on a graph where all combinations of goods can be purchased within the consumer's budget.
Unaffordable Region
The area on a graph representing combinations of goods that exceed the consumer's available income.
Axes
The horizontal and vertical lines on a graph used to display quantities of two different goods.
Origin
The point on a graph where both goods have zero quantity, serving as a reference for shifts.
Slope
A measure of how the budget line changes, reflecting the rate at which one good can be traded for another.
Shift
A movement of the budget line outward or inward, indicating changes in income or prices.
Combination
A specific mix of quantities of two goods that a consumer may choose within their budget.
Parallel Lines
Budget lines that maintain the same slope, indicating income changes without price changes.
Rotation
A change in the slope of the budget line caused by a price change in one good, holding the other constant.
 BackBack
 08:41
08:41