Skip to main content
Microeconomics
My Course
Learn
Exam Prep
AI Tutor
Study Guides
Flashcards
Explore
Try the app
My Course
Learn
Exam Prep
AI Tutor
Study Guides
Flashcards
Explore
Try the app
Back
Graphing Review definitions
You can tap to flip the card.
Arc Method
You can tap to flip the card.
👆
Arc Method
Technique for finding the average slope between two points on a curve by connecting them with a straight line.
Track progress
Control buttons has been changed to "navigation" mode.
1/15
Related flashcards
Related practice
Recommended videos
Graphing Review quiz #1
Graphing Review
9 Terms
Graphing Review
0. Basic Principles of Economics
10 problems
Topic
Percentage and Decimal Review
0. Basic Principles of Economics
10 problems
Topic
0. Basic Principles of Economics
13 topics
14 problems
Chapter
Guided course
02:36
Calculating Area of a Rectangle on Graph
3301
views
40
rank
Guided course
03:25
Calculating Slope of a Curve:Arc Method
4824
views
72
rank
1
comments
Guided course
03:02
Interpreting Graphs (Part Two)
3400
views
78
rank
Terms in this set (15)
Hide definitions
Arc Method
Technique for finding the average slope between two points on a curve by connecting them with a straight line.
Average Slope
Value representing the mean rate of change between two points on a curve, calculated using rise over run.
Point Method
Approach for determining slope at a single location on a graph, often used for straight lines.
Rise
Vertical change between two points on a graph, used in slope calculations.
Run
Horizontal change between two points on a graph, essential for slope determination.
Rectangle Area
Measurement found by multiplying the base and height of a rectangle on a graph.
Base
Horizontal dimension of a rectangle or triangle on a graph, used in area calculations.
Height
Vertical dimension of a rectangle or triangle on a graph, used in area calculations.
Omitted Variable Bias
Error in graph interpretation caused by leaving out a relevant factor, leading to incomplete analysis.
Reverse Causality
Mistaken inference where the effect is incorrectly assumed to be the cause in a relationship.
Causation
Relationship where one factor directly influences another, forming a cause-and-effect link.
Intersection
Point where a curve crosses another line or axis, often used for selecting calculation points.
Tangent Line
Straight line that touches a curve at a single point, representing instantaneous slope.
Compensation Equation
Formula relating factors such as education and experience to wage outcomes.
Correlation
Statistical relationship indicating how two variables move together, relevant in graph analysis.
 BackBack
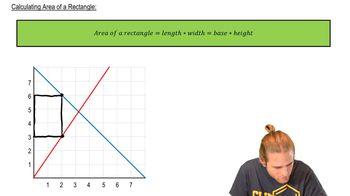
 02:36
02:36
