 Back
BackInfrared (IR) and Mass Spectroscopy: Principles and Applications in Organic Chemistry
Study Guide - Smart Notes
 Tailored notes based on your materials, expanded with key definitions, examples, and context.
Chapter 12: Infrared (IR) and Mass Spectroscopy (MS)
Introduction to Spectroscopy and Chemical Analysis
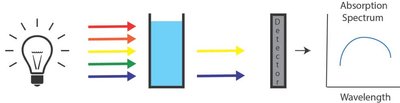
Spectroscopy is a fundamental analytical technique in organic chemistry, used to determine the structure, composition, and properties of molecules by analyzing their interaction with electromagnetic radiation. Mass spectrometry, while not a spectroscopic technique, is equally important for determining molecular weights and structural information.
Spectroscopy: Study of the interaction between electromagnetic radiation and matter.
Mass Spectrometry (MS): Measures mass-to-charge ratio (m/z) of ions, providing molecular weight and fragmentation information.
Wave-Particle Duality: Light exhibits both wave-like and particle-like properties.
Principles of Molecular Spectroscopy
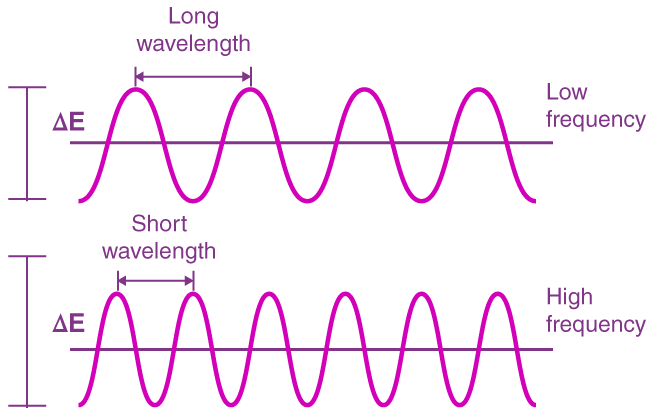
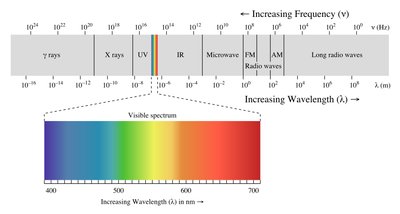
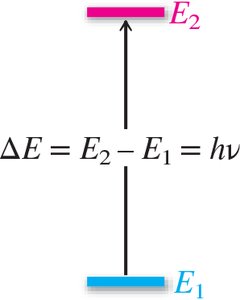
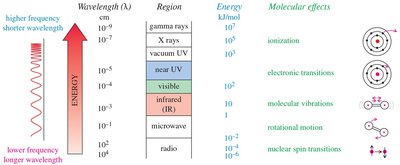
Electromagnetic radiation covers a broad spectrum, including visible, infrared, ultraviolet, and more. Molecular energies are quantized, and absorption of specific photon energies causes transitions between energy levels.
Frequency (ν): Number of wave cycles per second (Hz).
Wavelength (λ): Distance between two peaks of a wave.
Energy Relationship: (where h = Planck's constant).
Speed of Light:
Quantized Energy Levels:

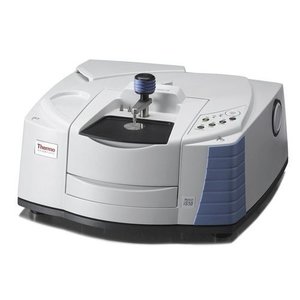
Infrared (IR) Spectroscopy: Principles and Vibrational Modes
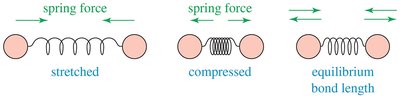
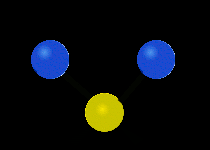
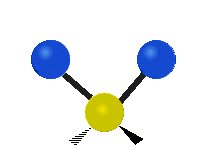
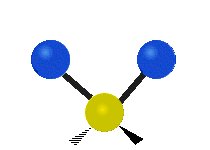
IR spectroscopy is based on molecular vibrations. Atoms in molecules vibrate like balls attached to springs, and IR light excites these vibrations. The frequency of vibration depends on bond strength and atomic masses.
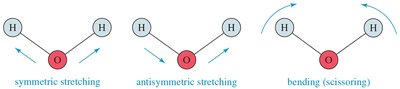
Vibrational Modes: Stretching (symmetric, asymmetric) and bending (scissoring, rocking, wagging, twisting).
Number of Vibrational Modes: Nonlinear molecule: ; Linear molecule: (n = number of atoms).


IR-Active and IR-Inactive Vibrations
Only vibrations that change the dipole moment of a molecule are IR-active. Symmetrical molecules may have IR-inactive vibrations.
IR-Active: Vibration alters dipole moment; absorption observed.
IR-Inactive: No change in dipole moment; no absorption.
Infrared Spectroscopy and Wavenumbers
IR spectra are typically represented using wavenumbers (cm-1), which are the reciprocal of wavelength. Wavenumber is directly proportional to energy.
Wavenumber Formula:
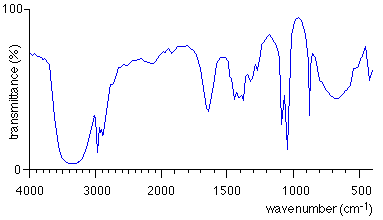
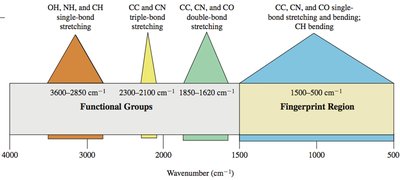
Regions in IR Spectra
The IR spectrum is divided into regions based on the types of vibrations observed. The fingerprint region (600-1400 cm-1) is unique for each molecule, while the functional group region (1600-3500 cm-1) provides information about specific functional groups.
Fingerprint Region: 600-1400 cm-1
Functional Group Region: 1600-3500 cm-1
Interpretation of IR Spectra
Different functional groups absorb IR radiation at characteristic frequencies. The following table summarizes typical IR stretching frequencies:
Frequency (cm-1) | Functional Group | Comments |
|---|---|---|
3300 | alcohol, amine, amide, alkyne | always broad; may be sharp or broad with spikes |
3000 | alkane, alkene | just above 3000 cm-1 |
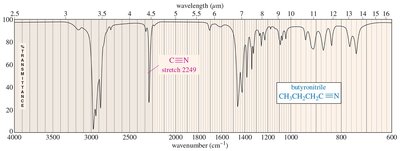
2200 | alkyne, nitrile | just below 2200 cm-1; just above 2200 cm-1 |
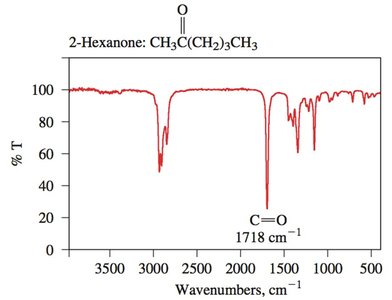
1710 | carbonyl | ketones, aldehydes, acids |
1660 | alkene, imine | conjugation lowers frequency |
Hydrocarbons: C–C (1200 cm-1), C=C (1660 cm-1), C≡C (<2200 cm-1)
C–H Stretching: sp3 (2800-3000 cm-1), sp2 (3000-3100 cm-1), sp (3000-3100 cm-1, sharp)
O–H and N–H Stretching: ~3300 cm-1, broad for alcohols, sharp for amines
Carbonyl Compounds: Strong, sharp peak around 1700 cm-1
Carbon–Nitrogen Stretching: C–N (1200 cm-1), C=N (1660 cm-1), C≡N (>2200 cm-1)
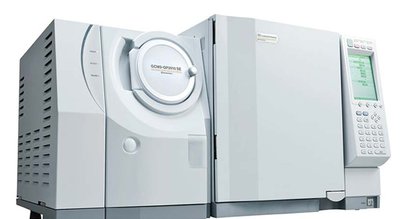
Mass Spectroscopy (MS)
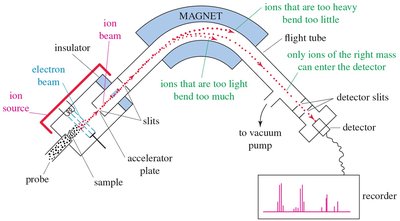
Mass spectrometry is a destructive analytical technique used to measure the mass-to-charge ratio (m/z) of ions. It is essential for determining molecular weights and elucidating structural information.
Ion Source: Sample is ionized, usually to cations.
Mass Analyzer: Ions are sorted by mass and charge.
Detector: Measures ions and displays results as a spectrum.
Ionization Techniques: Electron Impact (EI), Electrospray Ionization (ESI), Matrix Assisted Laser Desorption Ionization (MALDI).
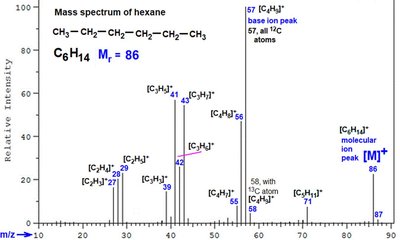
Fragmentation Patterns of Molecular Ions
Fragmentation occurs when molecular ions break into smaller pieces, producing characteristic patterns that provide structural information. Only charged fragments (cations) are detected.
Homolytic Cleavage: Produces cations and radicals; only cations are detected.
α-Cleavage: Cleavage next to carbonyl group produces resonance-stabilized acylium ions.
McLafferty Rearrangement: β-cleavage in carbonyl compounds, producing enol radical cations and alkenes.
Isotopic Peaks: Elements like chlorine produce multiple peaks due to isotopes.
Summary
Infrared (IR) and Mass Spectroscopy (MS) are indispensable tools in organic chemistry for structural elucidation. IR spectroscopy identifies functional groups based on characteristic absorption frequencies, while mass spectrometry provides molecular weight and fragmentation information. Together, these techniques enable comprehensive analysis of organic compounds.
